HomeUpSearchMail
NEW

Taphonomy in megalithic art (archaeology)

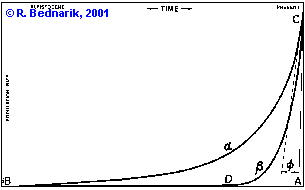
In this page I am using the description of Bednarik ([2001], page 156) for taphonomy:
Taphonomy deals with the logic underpinning the idea that the quantified characteristics of a record of past events or systems are not an accurate reflection of what would have been the record of the living system or observed event.

a curve is the produced objects and b curve is the surviving objects
point D is taphonomic threshold (as defined by Bednarik)
I am, using as part of taphonomy, the ideas behind the life time of objects/records as describe by the Weibull distribution. In general; taphonomy provides insight in the process that older objects tent to survive less than younger ones and that older ones are changed more than younger ones.
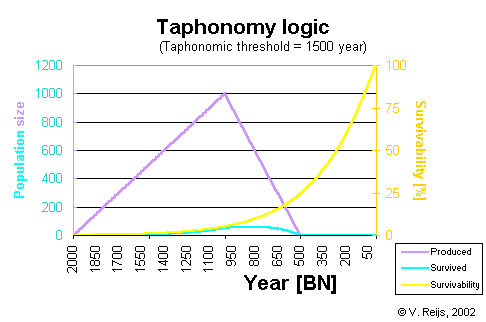
I assume that the following curves are important for taphonomy:
  1. The produced objects (light purple curve: using population y-axis)
  2. This curve is describing the amount of objects made in a specific year. I believe in the theory that the production is increasing fast (perhaps even exponential like most human products), then it reaches its peak slowly (like in an s-curve). After its peak it decreases fast/slowly (because nobody support it anymore, old fashioned, etc.). It could be that like with a lot of human related activities, that a kind of periodicy happens.
    But any production curve is possible of course.
  3. The survivability of a technology (yellow curve: using a different y-axis: 0 - 100%)
  4. The survivability in a specific year depends on the material the object has been made and its protection against deterioration of climate and/or other influences (animal/plant/etc.).
    In general this curve can be described as having an exponential increase towards the present times, where survivability is high (close to 100%), a taphonomic threshold value where the survivability is low (close to 0%), and a taphonomic lag period where the survivability is touching 0%.
    The survivability of an object could (in my opinion) be described by the Weibull reliability formula:
    R(T) = e -(T/h)^d
    with: h: scale parameter
            d: slope/shape parameter
    I use the values of resp. 99.9% and 1% to determine h and d.
    Of course this only gives an approximation of this function. This curve can perhaps be determined with accelerated life testing methods. The method also provide input how temperature and humidity (important aspects of the lifetime) effect life time, so that aligns good with rock art (indoors or outdoors).
    The survivability function can be any function. including discontinuities due to climate changes, destruction by living beings, etc.
  5. The surviving objects (light blue curve: using population y-axis)

  6. This is the combination (arithmetic product) of produced objects for a specific year and their survivability for a specific year.
    This curve can perhaps be determined with dating methods (like 14C dating). For most megalithic art this direct dating methodology is not available. 
    Example:

    The above example provides an idea of taphonomy. The taphonomic threshold (of the yellow curve) is here 1500 years. So before 1500 BN (Before Now; I don't use BP [Before Present] because in 14C terms that is 1950 CE, while I mean really now) the number of surviving objects is almost zero (light blue curve), although the number of produced objects is quite high (light purple curve). So when evaluating finds; don't assume that they were not produced just because the number of finds is very low! This is due to the survivibility.
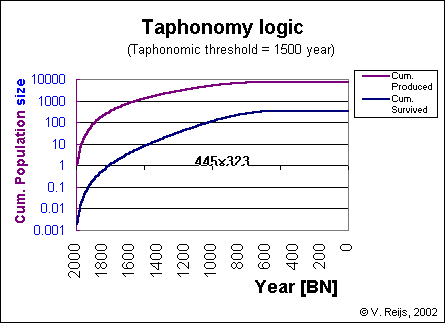
  7. The cumulative produced objects (dark purple curve)
  8. This is the cumulation of all produced objects up until a specific year.
  9. The cumulative survived object (dark blue curve)
  10. This is the cumulation of all surviving objects up until a specific year.
    It will be very difficult to determine this curve because one needs to be sure that all surviving objects are found and even then one only finds a point on this curve, the present point. I assume that only a random part of this cumulation can be found (it is not only random, because it will also be determined by location of sites, preference of people looking for the objects, etc.). The cumulative curves can be seen below:

Taphonomic thresholds

The thresholds are dependent on the technology used and the climate influences. Some guidelines (Bednarik [2001], page 157):

Weathering of rock surfaces

Weathering of exposed rock surfaces under central European climatic conditions is as follows (Bednarik [2001], page 61):
 
Rock type Weathering
[mm/1000 years]
Sandstone* 5-50
Limestone* 2-20
Schist 1-10
Marble 0.4-5
Dolomite 0.3-2,5
Serpentine 0.25-2.5
Diabase, porphyry, greywake* 0.2-2
Gabbro 0.1-1.5
Diorite 0.1-1
Quartzite 0.1-0.5
Granite 0.05-0.2
* rock type found in building material of Boyne Valley mounds.


Disclaimer and Copyright
HomeUpSearchMail

Major content related changes: May 14, 2002