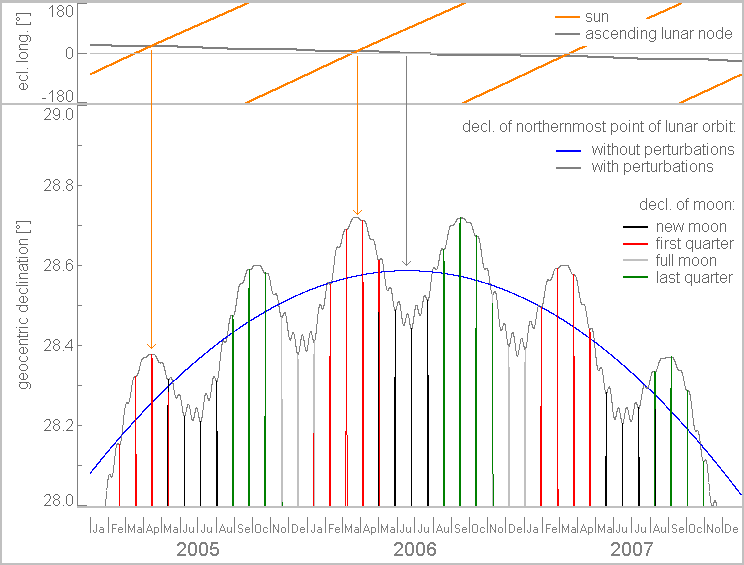
The blue line reaches a maximum every 18.61 years, the duration of one complete nodal cycle. This is also the mean duration of one standstill limit cycle, but the details are somewhat more complicated than this simple picture.

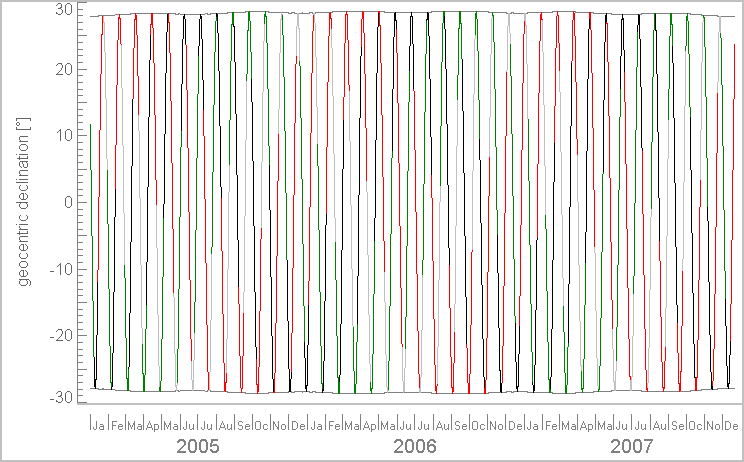
The phases coinciding with high northern declinations are first quarter in spring, new moon in summer, last quarter in autumn, and full moon in winter.
The below picture shows a magnified view of the declination range
from
28° to 29° for the same time interval. The blue
line represents the envelope of declination of the northernmost
point of
the moon's orbit (the moon itself will follows the red, green,
black and
grey curves of course), assuming that the inclination is constant
and the
nodes regress with constant speed. Under these conditions, the
envelope
of the orbit would reach its extreme declination when the
ascending node
aligns with the vernal equinox (that is, the node's ecliptical
longitude
passes through zero, see top diagram) and the lunar inclination
therefore
simply adds to the obliquity of the ecliptic (23.44°
+ 5.15° = 28.59°).

The blue line reaches a maximum
every
18.61 years, the duration of one complete nodal cycle. This is
also the
mean duration of one standstill limit cycle, but the details are
somewhat
more complicated than this simple picture.
In reality, a perturbation term with amplitude 8.65' (plus other, minor terms) and a mean period of ca. 173 days is superimposed on the inclination, and the speed of the nodes shows small wobbles, too. As the result the envelope of the northernmost points of the lunar orbit (gray line) oscillates around the idealized blue line, and the real northern extreme of the lunar orbit is reached close to the maximum of one of these wiggles. The wobble maxima occur when the sun passes through one of the lunar nodes (see top diagram), hence the above mentioned period of ca. 173 days. As in the vicinity of a major standstill limit the ascending lunar node is close to the vernal equinox, this means that the sun is close to an equinox, and thus major standstills are biased to occur close to the equinoxes, despite their mean period of 18.61 years which is not an integer multiple of the distance between two equinoxes. In effect, the standstill limit cycle is found to be of a length clustered around 18, 18,5 and 19 years.
The declination of the moon oscillates monthly between the
extrema allowed
by the current disposition of the orbit (the above mentioned
envelope)
and is thus constrained by the variable circumstances discussed so
far.
However, the inclination of the orbit changes appreciably on time
scales
comparable to a month, and therefore a high inclination of the
orbit may
happen while the moon is far from the northernmost point of the
orbit,
and it may already be gone when the moon reaches this point. So
the question
of the moon reaching extreme declinations is a matter of successes
and
missed opportunities: the inclination of the orbit must be high and
the moon must pass through the northernmost point of the orbit.
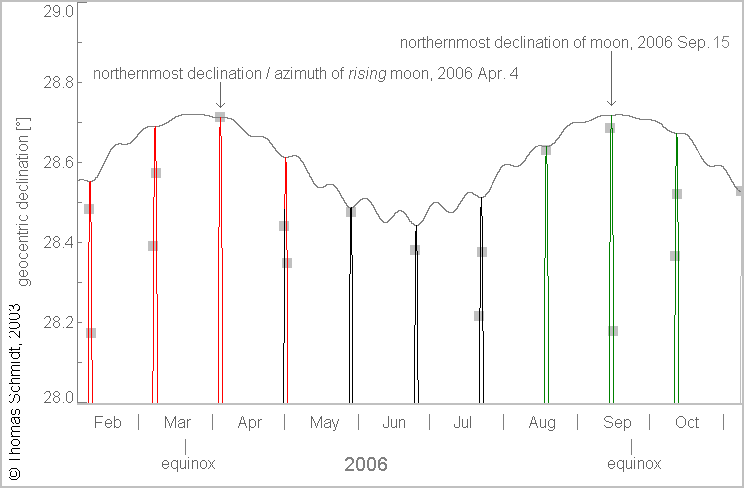
In 2006 it happens that two perturbation wobbles lie roughly
symmetrical
to the idealized unperturbed declination maximum and are
therefore
of comparable height. The below picture shows these two wobbles in
detail.
The moon misses the maximum of the March wobble by about half a
month,
but in the September wobble it happens to pass through the
northernmost
point of its orbit close to the time where the orbit has maximum
inclination.
The maximum northern geocentric declination of the moon for the
2006
standstill season is therefore reached on September 15th,
1:28
TD (28°.7227), with the maximum of April 4th, 7:38 TD
(28°.7150)
as a close runner-up.
However, a megalithic astronomer who is (supposedly) constrained to measure the position of the moon at the instants of rising or setting azimuth will in general miss these maxima declinations and can only assess the maximum azimuth of those positions of the moon that are observed at rising or setting, which is a relatively small and very specific set of observations. The below picture displays the rising declinations of the moon computed for Callanish I and the 2006 standstill season as gray squares. It is immediately evident that the maximum observed rising declination is for most months markedly less than the maximum declination reached in that month (but at a time where the moon didn't happen to rise).
On average, the moon covers 13° along its orbit per day, so from one moonrise to the next the moon will have wandered about 13° (very roughly). Imagine that the orbit is subdivided into these 13°-segments, and that moonrise happens whenever the moon passes from one segment to the next. The northernmost point of the orbit will lie somewhere in one of the segments. It may happen to lie right at a segment boundary, then the corresponding moonrise will be an extreme one, and the declination of the rising moon will be the maximum declination allowed by the current orbit. But the northern-most point may also lie in the middle of a segment; then the passage of the moon through this month's maximum declination happens between two risings and goes unseen by the megalithic astronomer. At the preceding or the following moonrise, the moon will be 6.5° away from the northernmost point, and its declination will be 0.2° less than the maximum. For all other positions of the northern-most point in a segment, one of the boundaries is closer than 6.5°, so that is the maximum by which the passage through the maximum can be missed.
These cases can be identified in the below picture: the moonrises
of
May 1st (5:23 UT) and May 2nd (6:21 UT) are
almost
equidistant from the passage through the maximum declination on
May 1st
(16:33 UT), so at both instants the moon's declination is roughly
0,2°
short of the maximum (28.44° and 28.35° versus 28.61°).

On the other hand, on April 4th, May 29th, August 18th and September 15th the moon rises when it is close to maximum declination, and the observer will note extreme rising azimuths. Assuming that the observer is not hindered by bad weather or other obstacles, his observation report will finally comprise all the gray squares in the diagram, and the northernmost moonrise in this set of observations will be the one of April 4th, 2006. This moonrise happens to almost coincide with the maximum declination the moon reaches in the March/April perturbation wobble, the time difference is only five minutes.
As discussed earlier, the moon reaches an even higher declination in the September wiggle, on September 15th. But here the closest moonrise happens 5 hours earlier than maximum declination, and the moonrise declination is therefore 0.04° less than the maximum.
For convenience and consistency, the foregoing discussion was
considering
the behavior of extreme geocentric declination. The analysis of
megalithic
structures however involves extreme rising or setting azimuths
which in
turn depend on topocentric longitude. The change in longitude may
give
slightly different ranking of extreme azimuths than the ranking of
geocentric
declinations. The definitive analysis for each location should
therefore
be done in terms of azimuths.
Last major content related changes: Feb. 19th, 2003