Simuleren van wind bij Ren artikel
Simuleren van wind bij Ren artikel
by Victor Reijs
is licensed under CC BY-NC-SA 4.0


Introductie
Als voorbeeld is op deze web pagina een simulatie voor een boom
(volgens artikel van Ren, 2023)
Deze webpagina heeft de volgende paragrafen:
Sorry for the two langauges gebruikt in deze webpagina!
Vette paarse tekst heeft nog extra
aandacht nodig.
Findings by Ren
Information on surroundings
- Ren's representation [2023]
of the results don't look to be consistent:
- The color scale in Figure 16 (right
top of figure) has a different labelling than in the
individual curves in Ren's simulation graphs. For instance
middle-dark blue in the color scale is from 2.0 to 3.0m/sec,
while in the graph it is from 1.0
to 2.0m/sec:
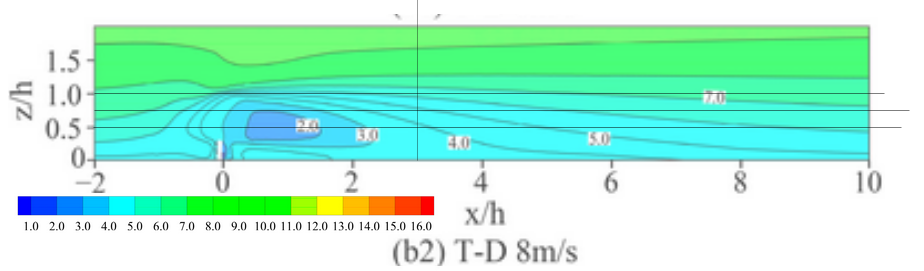
- The curve that starts close to z/H=1
(in Figure
16) shows the speed of 8m/sec, so the title of the
graph seems to match the numbers in the graph. So the color
scale migth be wrong.
- I have asked feedback (in Dec. 2023
and Dec. 2024) from the authors of [Ren, 2023]; until now
no reaction. See also next remark.
- In the below the numbers in the graph have been used (and
not the color scale).
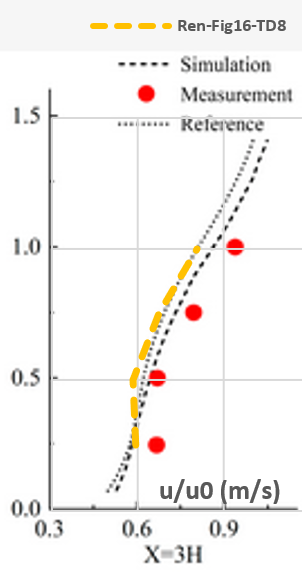
- Comparison measurments and simulations
- The definition of u0 in Figure 13, it looks to be
the wind speed in the simulations (Figure 16) at x=-2Htree
and at the same height as where measured behind the obstacle.
- Say we look at the x=3Htree graph (most right in
Figure 13). In below graph you see dashed yellow line
(which were derived from Figure 16) and the black dashed line
(which is according to Ren's legend their simulation in Figure
13). So things are comparable. Another proof that the numbers
in the graph are correct (and not the colorscale).
- The location is where the yellow pin is located (Zjejiang
Agriculture and Forestry University in China):
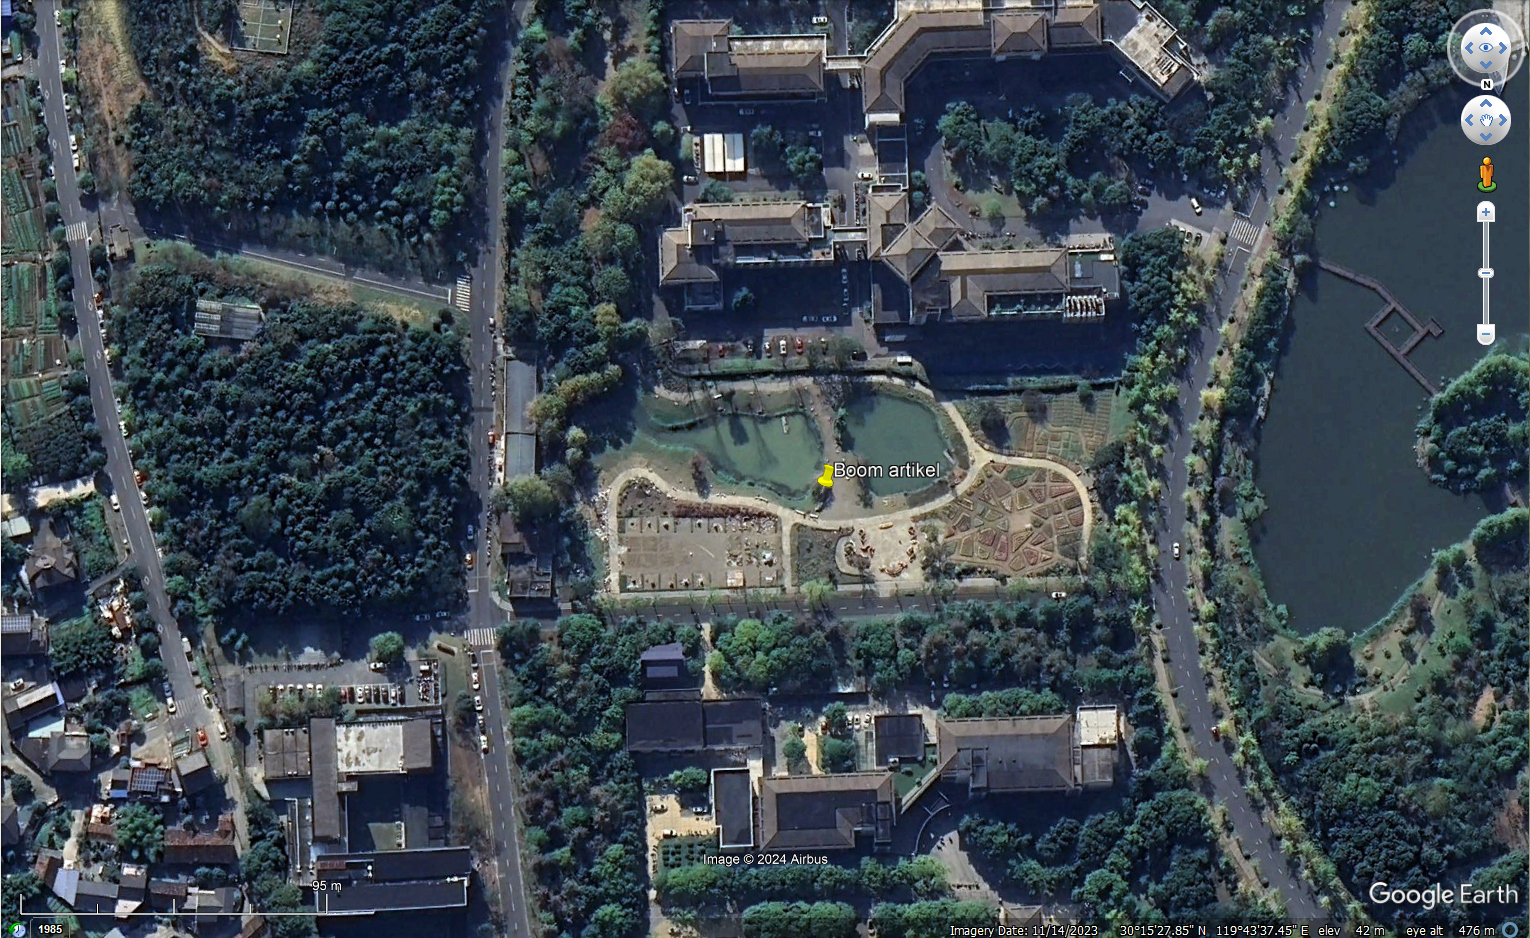
- No z0 was given, but looks to
be parkland, bushes;
numerous obstacles, so a z0 = 0.5m is assumed.
It used the standard k-epsilon turbulence model [Ren,
2023, section 2.4].
- Ren's measurements [2023, section 3.2] were done at 5Bft (8 to
10.7m/sec@10m), so in SIMSCALE simulations an uHtree=8m/sec
is used.
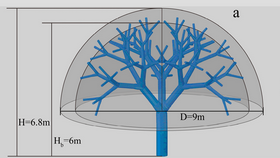
- The Ren's tree measured [Ren, 2023, Figure 8] Htree
=6.8m:

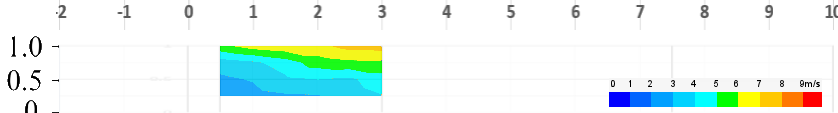
Ren's measurements [2023, Figure 13] are below represented in a
different graphical way (using the coloring scheme of the below
SIMSCALE graphs). As u0
is not given for the measurements, the wind speed in Figure 16
has been used at x=-2Htree and at
the same height as where measured behind the obstacle:
- Ren's modelled tree [Ren, 2023, 1a]:
If we compare the measured (colored) values [Ren, 2023, Figure
13] with the simulated (black lines; standard k-epsilon
and AP=0.52@8m/sec) values [Ren, 2023, Figure 16 (a2) T-S 8m/s]:
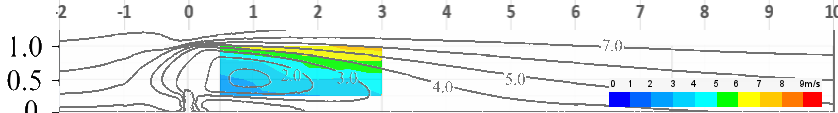
The speeds values are not mapping, see
also inconsistency above. But the form of the
curves and colors looks to map, which is a good sign.
Remark: This stil needs to be
interpreted better! Is the u0 wrong?
Modelling the proxies for a tree
Different tree proxies
Four proxies for a tree have been checked with SIMSCALE:
- A blobbed proxy
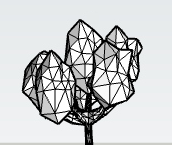
A CAD-model available
for a leaved tree is used for this blobbed tree proxy. No porocity was added as
the model itself already has openings included.
Crown: diameter 9m, height 5m with a trunk of
1.8m; Realizable k-epsilon; Meshing fineness=9
- A stacked cylinder proxy
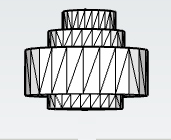
Crown: diameter 9m, height 5m raised up by 1.8m for its trunk;
Realizable k-epsilon; Meshing fineness=5
The 3D model of this proxy
has problems with higher meshing (F=7.5): not getting
simulation convergence. So not further pursued.
- A single cylinder proxy
See for an
example below.
A single
cylinder from top to bottom and left to right leaves of
the crown.
Crown: diameter 9m, height 5m raised up by 1.8m
for its trunk; f=1.2; Realizable k-epsilon; Meshing
fineness=9
- An effective single
cylinder proxy
See for an example below.
A single cylinder from top to
bottom and left to right leaves of the crown migth be too
wide, so an effective width and heigth is estimated.
Crown:
diameter 8.58m, height 4.25m raised up by 1.73m
for its trunk; f=1.4; Realizable k-epsilon; Meshing fineness=9
Working in SketchUp
- 3D model of five 'trees' (which will
get different porosities in SIMSCALE) in SketchUp. Stacked cylinder,
single cylinder and effective single cylinder
models have been implemented. In case of the blobbed proxy only
one 'tree' was modelled, as no porosity has been used.
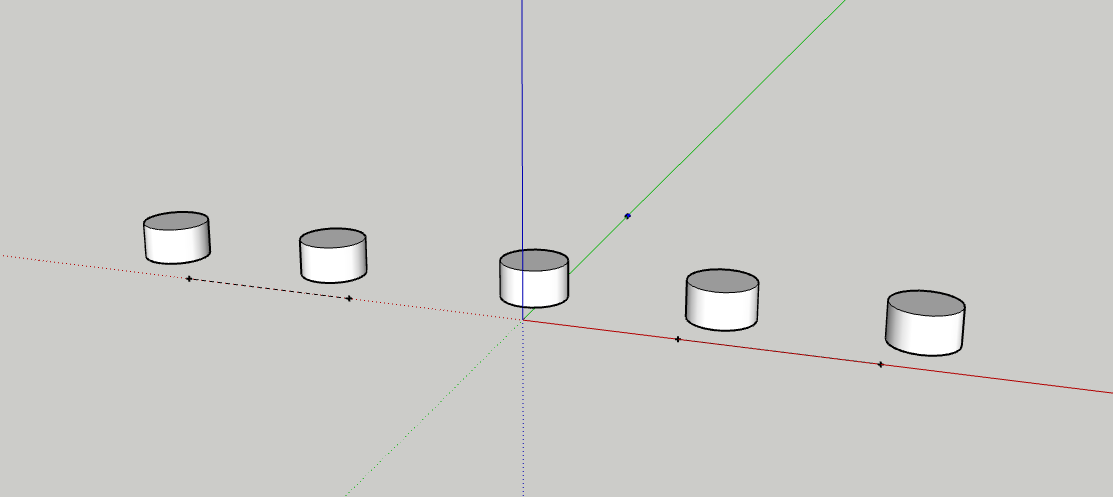
- Include at the back (50m or 100m from the trees) a small
(dummy) box (which is needed for being able to simulate things
in CFD in case all other objects will have porosity)
- Sluit af als klaar: 'Save' en 'Download' -> 'STL'
- Effort: 0.5 hours for each proxy
Editing 3D-model in SIMSCALE
We are making use of SIMSCALE. Make sure
you make a Community Plan
account. This Community Plan allows only for 10 simulations (but
one can do many more; but with more manual work). Anyway make
sure you have a good CAD-model and that you train/educate yourself around SIMSCALE.
The following steps can be done:
- The different proxy simulations are here:
- Import het STL
model
- Edit this (not yet rotated) model by: Edit a copy
- Make a Flow Volume -> External waarbij de
poreuze poxies (bomen: 'Excluded parts') niet deelnemen aan het
'External flow volume'.
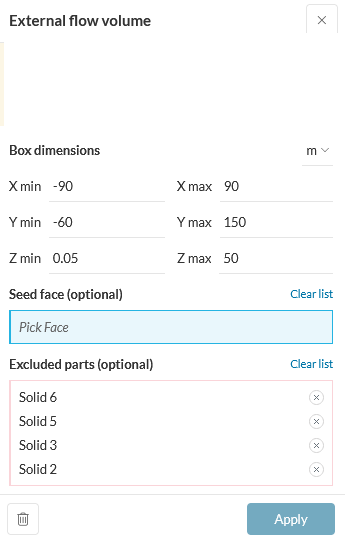
Zie voor richtlijnen mbt vrije afstanden rondom het model hier [Franke,
2007]:
- Xmin, Xmax: minimaal 5*hoogte/grootte hoogste
obstakel [Franke, 2007, page 17] extra aan linker en rechter
kant van 3D-model. In dit geval ~5*~6.8m (fence): ~ 40m
- Ymin: Distance in front of model (in Y-direction)
minimaal 8*hoogte/grootte hoogste obstakel [Franke, 2007,
page 18] extra aan voorkant van 3D-model. In dit geval
~8*~6.8m (fence): ~ 60m
- Ymax: Distance at back of model (in Y-direction)
minimaal 15*hoogte/grootte hoogste obstakel [Franke, 2007,
page 18] extra aan achterkant van 3D-model. In dit geval
~15*~6.8m (fence): ~ 100m
- Zmin: Ground (in Z-direction) minimaal om invloed
van modelerings afrondingen (gaps) te voorkomen: ~
0.05m
- Zmax: Height (in Z-direction) minimaal
6*hoogte/grootte hoogste obstakel [Franke, 2007, page 17].
In dit geval ~6*~6.8m (fence): ~ 50m
- There is also a directional blockage ratio defined (mainly
imortant for the lateral direction) [Blocken, 2015, formula
(13)): being BRL=Lbuilding/Lflowvolume
<=17%
For this model this BRL is observered, as BRL=9/89=10%
- By the way, the default values in SIMSCALE were always
somewhat larger than the above, so its defaults are also ok.
Except for Zmin; I would put that always around 0.05m.
- Delete the dummy box, but not the tree(s)
- Save
- Effort: 0.25 hours for each proxy.
Configureren van de CFD
Take the following steps (if not default, it is explicitly shown
in below steps)
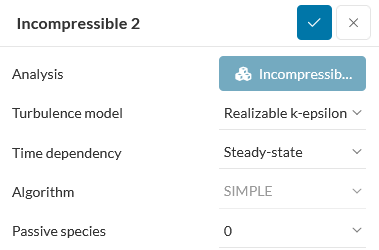
- Goto SIMULATIONS +
- Incompressible -> Turbulence-model -> Realizable
k-epsilon [Franke, 2007, page 14] [Franke, 2007, section
B.2.1 for PWC]
Standard k-epsilon and k-omega
SST will also be used to provide insight and make
comparisons.
- Materials -> Air -> Apply
Assigned Volumes -> Flow region
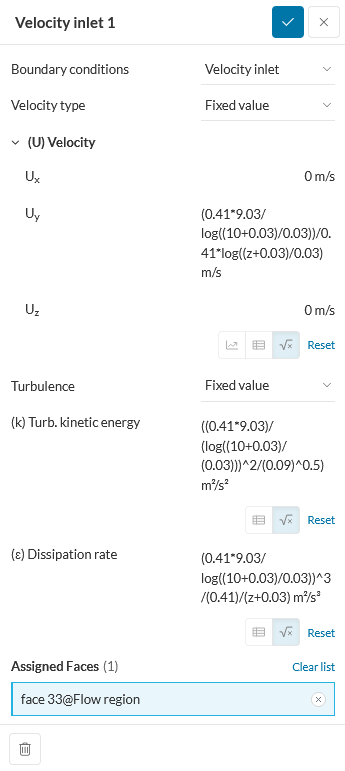
- Boundary conditions
- Velocity Inlet
Assigned Faces -> the wind side
(U) Velocity -> Uy -> ABL Formula
(9.08m/sec at 10m and z0=0.5m, the wind direction
is 180deg [S])
(0.41*9.08/log((10+0.5)/0.5))/0.41*log((z+0.5)/0.5)
Turbulence -> Fixed value
(k) Turb. kinetic energy -> ABL derived Formula
(0.41*9.08/log((10+0.5)/0.5))/(0.41*(0.09)^0.5)*1/(z+0.5)
(ω) Specific dissipation rate -> ABL derived
Formula
(0.41*9.08/log((10+0.5)/0.5))/(0.41*(0.09)^0.5)*1/(z+0.5)
(ε) Dissipation rate -> ABL derived Formula
(0.41*9.08/log((10+0.5)/0.5))^3/(0.41)/(z+0.5)
Save
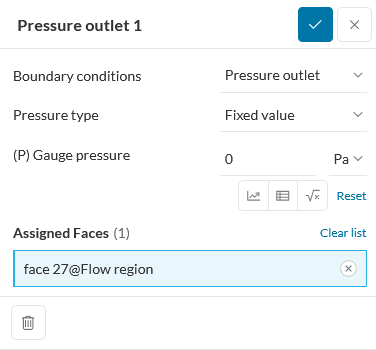
- Pressure outlet
Assigned Faces -> opposite inlet side
Save
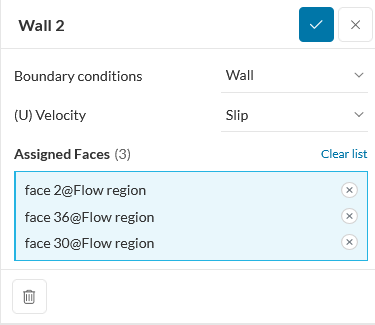
- Wall
Assigned Faces -> two sides and top
(U) Velocity -> Slip
Save
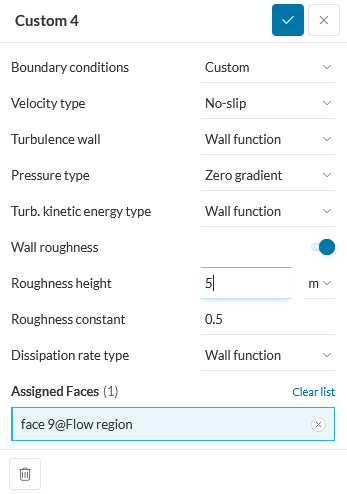
- Custom (ground)
Assigned Faces -> bottom side
Wall roughness -> On
Roughness height -> 5m (kS; 5m (~10*z0),
[Blocken, 2015, formula (15)]. as SIMSCALE is based on
OPENFOAM and Cs=1)
Roughness constant -> 0.5
Save
- Mesh
25m fence: Fineness = 7.5 (1.5Mcells)
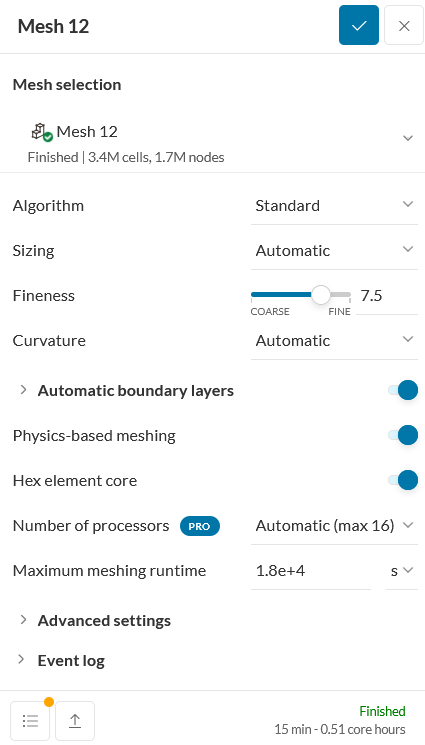
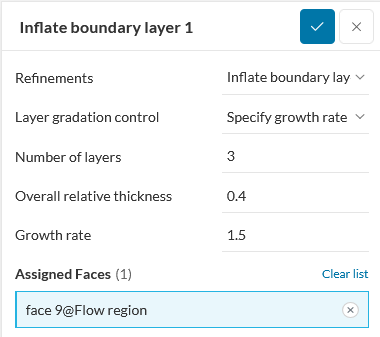
- Mesh -> Refinements -> Inflate boundary layer
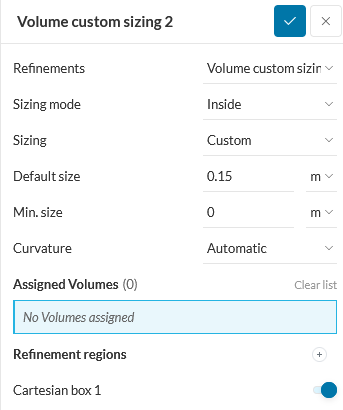
- Mesh -> Refinements -> Volume custom sizing
- Mesh -> Geometry
primitives
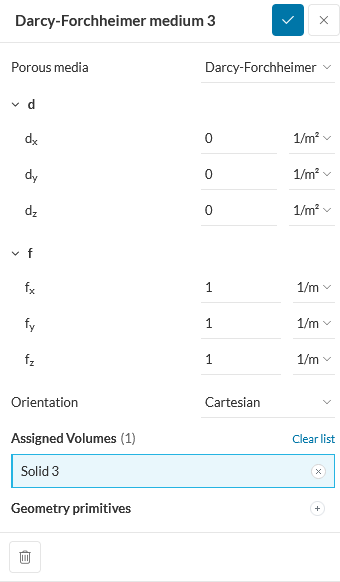
- Advanced concepts -> Porous media ->
Darcy-Forchheimer Medium
Forchheimer coefficent f=1.4, 1.2, 1, 0.8, 0.6
- Effort: 0.75 hour for each proxy.
Uitvoering van de CFD
- Simulation Runs +
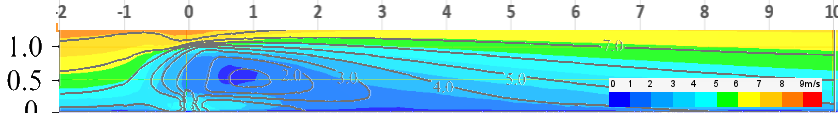
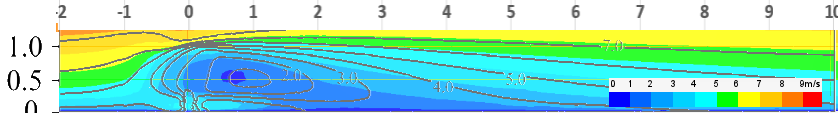
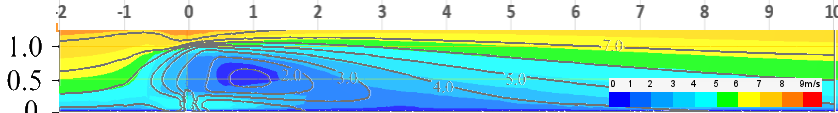
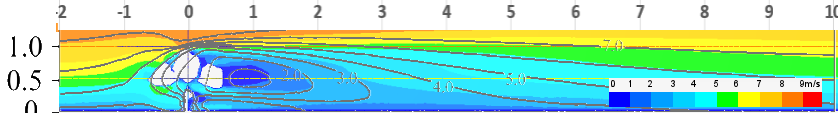
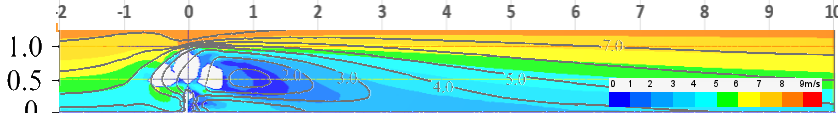
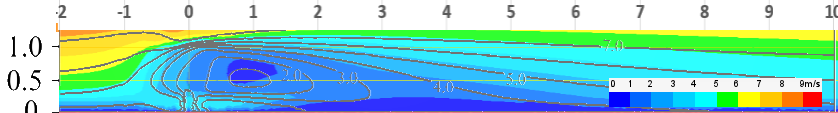
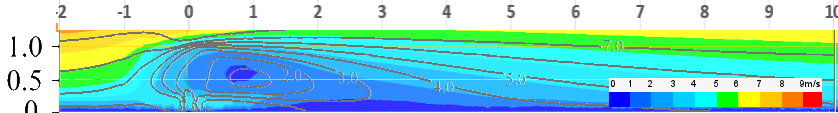
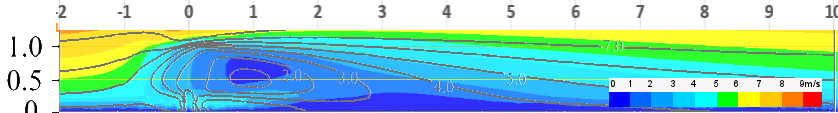
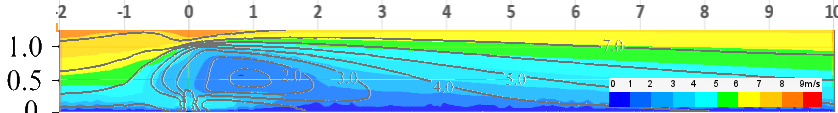
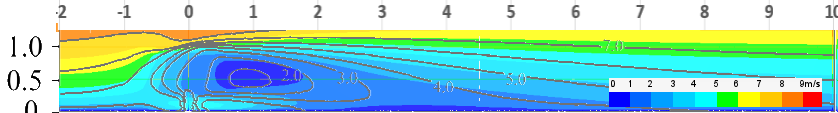
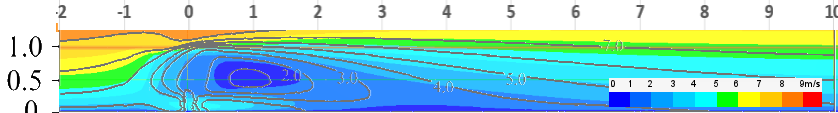
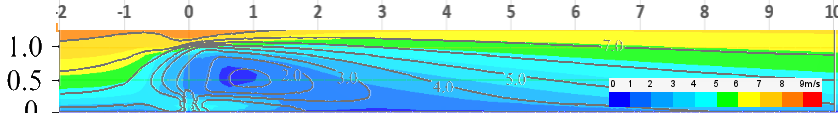
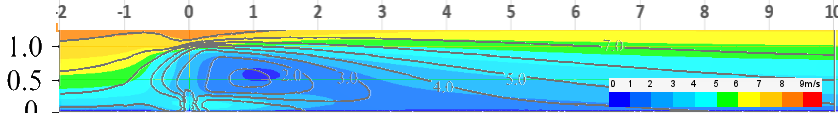
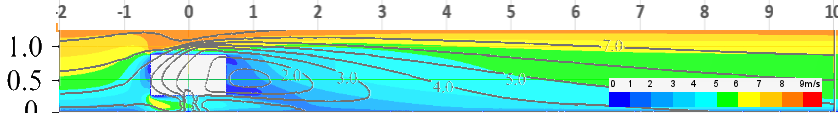
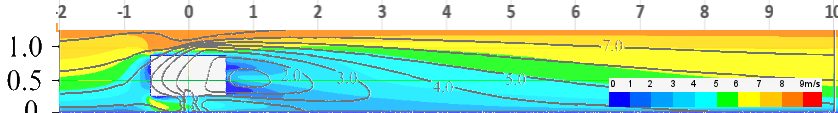
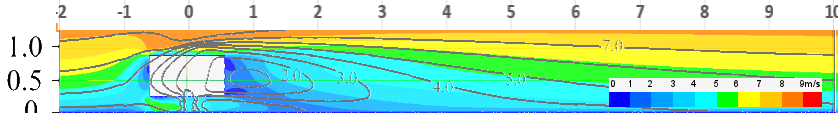
- In all graphs the magnitude of the wind speed is provided.
-
Proxy
|
Tubulence
model
|
Mesh
fineness
|
Porosity
|
Output (x and y-axis
and in steps of Htree
[=6.8m]).
Gray contours are Ren's simulation at uHtree=8m/sec
|
Ren's
measurement
and model
|
k-epsilon |
N/A
|
AP=0.52
|
|
Effective
single
cylinder
|
Realizable
k-epsilon |
9
|
f=1.4
|
|
|
|
|
|
| k-epsilon |
9
|
f=1.4 |
|
k-omega
SST |
9
|
f=1.4 |
 |
Blobbed
|
Realizable
k-epsilon |
9
|
N/A
|
 |
| k-epsilon |
9
|
N/A |
 |
k-omega
SST |
9
|
N/A |
 |
Single
cylinder
|
Realizable
k-epsilon |
9
|
f=1.2
|
 |
| k-epsilon |
9
|
f=1.2
|
 |
k-omega
SST |
9
|
f=1.2
|
 |
Stacked
cylinder
|
Realizable
k-epsilon |
5
|
f=1.2
|
|
- Ren's measurements and simulation don't match! There is some
2m/sec between the contours. This is possibly related to the
inconsistancy mentioned earlier.
- Realized k-epsilon (recommended by Franke [2007]) and standard
k-epsilon (used by Ren [2023]) provide quite similar results.
- k-omega SST always provided a higher wind profile for leeway
positions. Remember k-omega SST is not a recommendated CFD for
urban situations [Franke, 2007].
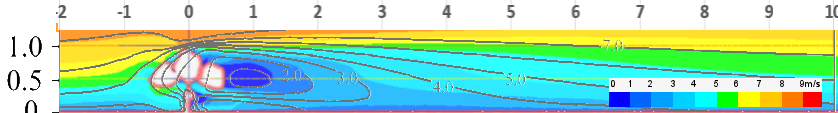
- The Blobbed proxy provides a wind profile closest to Ren's
wind profile, but it has the problem that the porosity is not
explictily defined, so it makes adjusting to other trees species
or summer/winter effect more difficult.
- Meshing sizing recommendations [Green Mark department, 2007]:
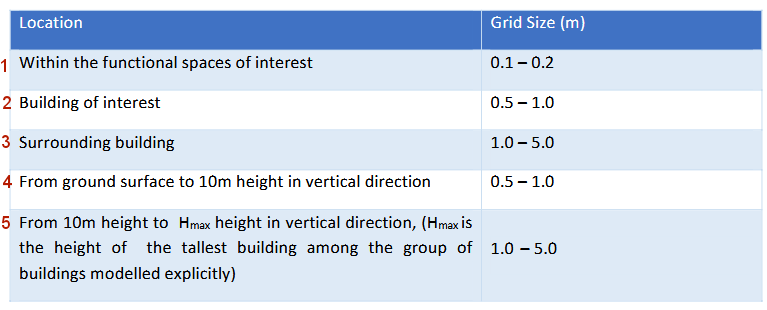
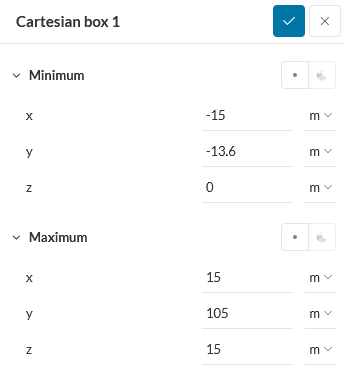
- When increasing the number of
meshing cells (by using a Cartesian Box around the proxy
towards the end of the flow volume), at a certain size the wind
profile becomes (very) different. With porous medium (white,
yellow background) this non-convergence happens quite explictly
(0.2m), with a solid
obstacle (green background) this happens perhaps at smaller mesh
default size (0.15m).
So what is the best mesh size: 0.3m or is 0.2m (with a lot
of likely detail?) the best????
Proxy
|
Turbulence
model
|
Mesh
fineness
F is for whole external
flow volume
DS is for a Cartesian box
over the tree towards end
|
Porosity
|
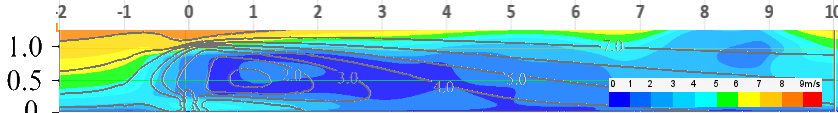
Output (x and y-axis
and in steps of Htree
[=6.8m]).
Gray contours are Ren's simulation at uHtree=8m/sec
|
Mesh
size
|
Effective
single
cylinder |
Realizable
k-epsilon |
F=5.1 & DS=0.2m*
|
f=1.4 |
 |
21M
|
| F=5.1 & DS=0.3m |
 |
4.8M
|
| F=5.1 & DS=0.4m |
 |
4.3M
|
| F=5.1 & DS=0.5m |
 |
1.6M
|
| F=9 |
|
6.6M
|
| F=5.1
& DS=0.3m |
f=0.9 |
 |
4.8M
|
| F=5
& DS=0.15m* |
NA
|
 |
19M
|
| F=5
& DS=0.2m |
NA
|
 |
18M
|
| F=5
& DS=0.3m |
NA
|
 |
4.2M
|
* For small mesh default size, the porous
medium's (DS=0.2m)
and solid obstacle's (DS=0.15m)
wind profile results seem not to converge.
- At a leeway distance of 10Htree all turbulence
models, sensible mesh sizes and sensible porosites look to have
similar wind profiles. This is expected as the influence of an
obstacle becomes much smaller after 10H, so the sensitivity is
not that large for leeways of 10Htree. For nearby
distances there is more variation.
- My simulated solid obstable's wind profile looks very close to Ren's
simulations (of a porous medium)!
Remark: In some way a strange result.
- Effort: 5 hours per proxy (incl. sensitivity analysis).
Conclusions
- Most default values of SIMSCALE look ok, except:
- Use Realizable k-epsilon
- Zmin should be always 0.05m
- The higher the Fineness the better, somewhere
between 7.5 and 9 (instead of default of 5), or better: use
your own mesh configuration.
- Thoughs about the meshing:
- All mesh metrics stay within their defined min and max range;
at least for Fineness tested between 5 and 9.2 and
this 3D-model.
All residuals are smaller than 10-3.
- hgsajkf kfjhajkfh
- An overview of outstanding issues/questions/etc is here.
References
Blocken, Bert et al.: Modification of pedestrian wind comfort in the
Silvertop Tower passages by an automatic control system. In: Journal
of Wind Engineering and Industrial Aerodynamics 92 (2004), pp.
849-873.
Blocken, Bert: Computational Fluid Dynamics for urban physics:
Importance, scales, possibilities, limitations and ten tips and
tricks towards accurate and reliable simulations. In: Building and
Environment 91 (2015), pp. 219-245.
Franke, Jörg et al. COST Action 732: Best
practice guideline for the CFD simulation of flows in the urban
environment. Brussels, COST Office 2007.
Green Mark Department: BCA GREEN MARK FOR RESIDENTIAL BUILDINGS:
Technical guide and requirements. In: (2017), issue GM RB: 2016.
Ren, Xinyi et al.: The influence of wind-induced response in
urban trees on the surrounding flow field. In: Atmosphere
14 (2023), issue 1010, pp. 1-23.
Acknowledgements
I would like to thank people, such as
and others for their help, encouragement and/or constructive
feedback. Any remaining errors in methodology or results are my
responsibility of course!!! If you want to provide constructive
feedback, please let me
know.
Major content related
changes: December, 21, 2024
-90