NEW
Validating
measurements at Rijn en Lek by Victor Reijs
is licensed under CC BY-NC-SA 4.0![]()
![]()
![]()
![]()
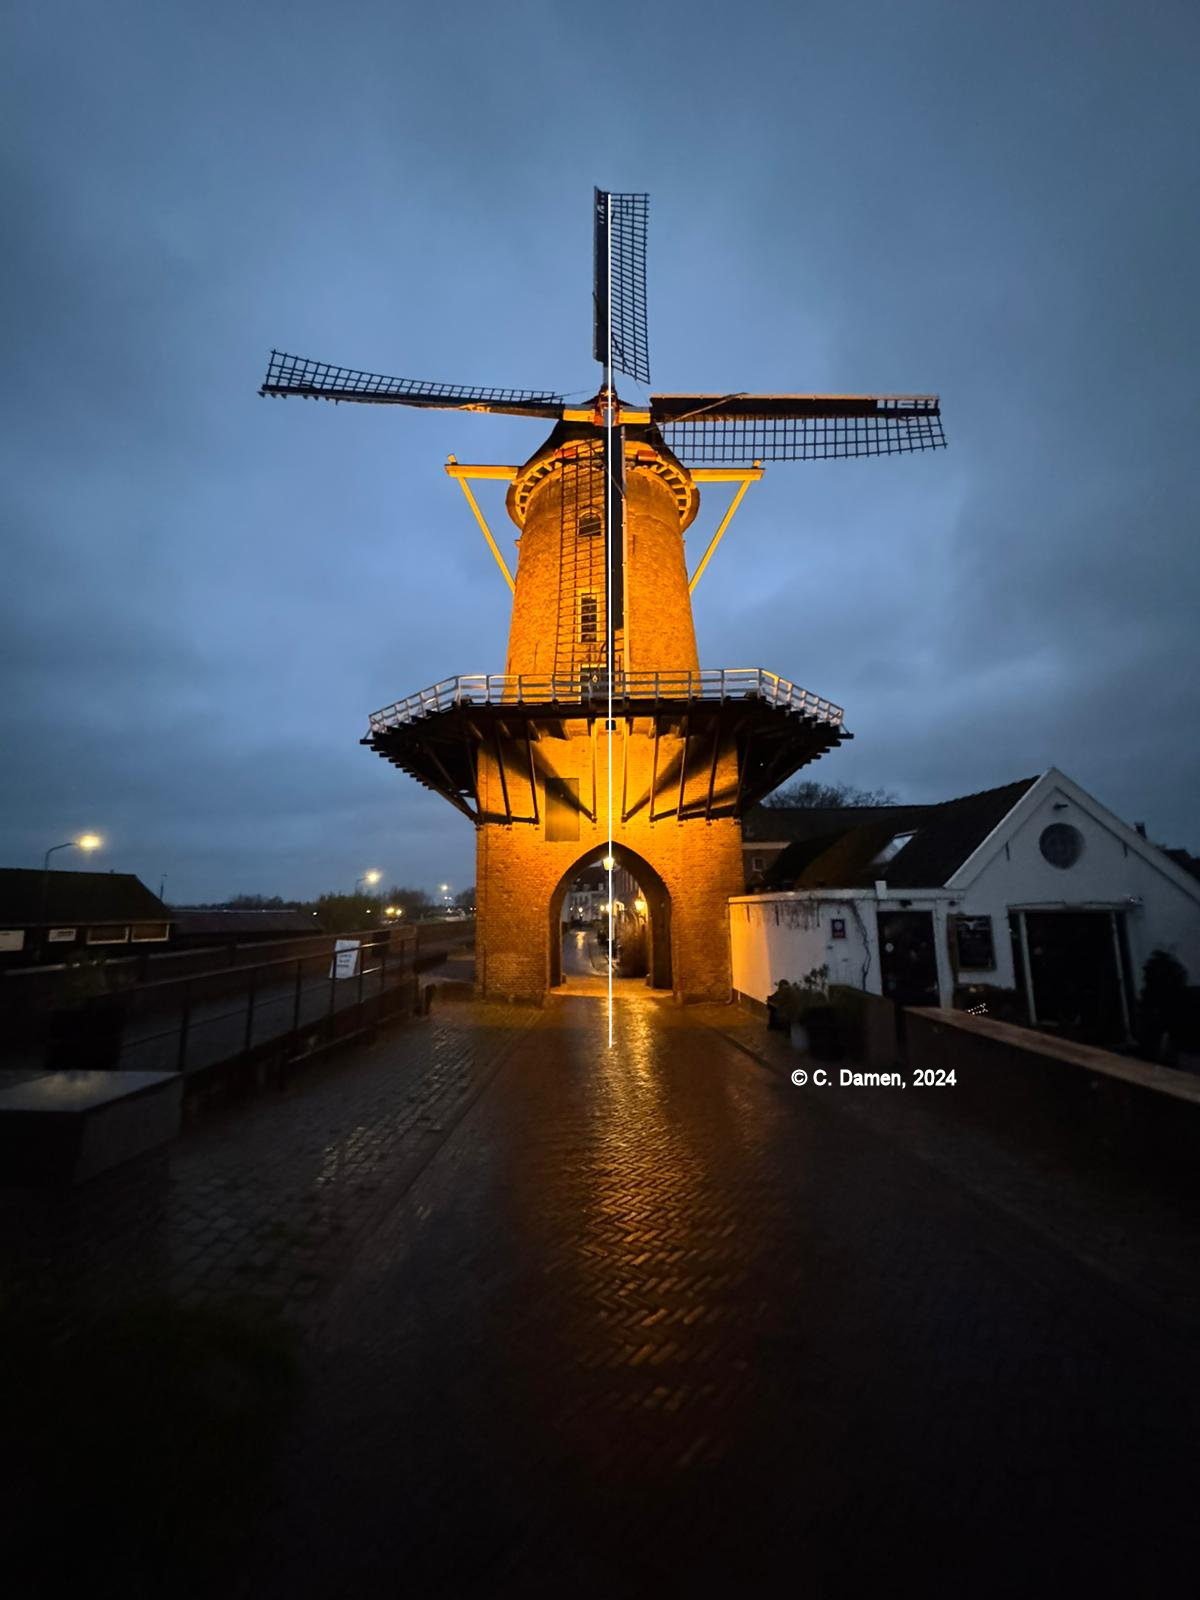
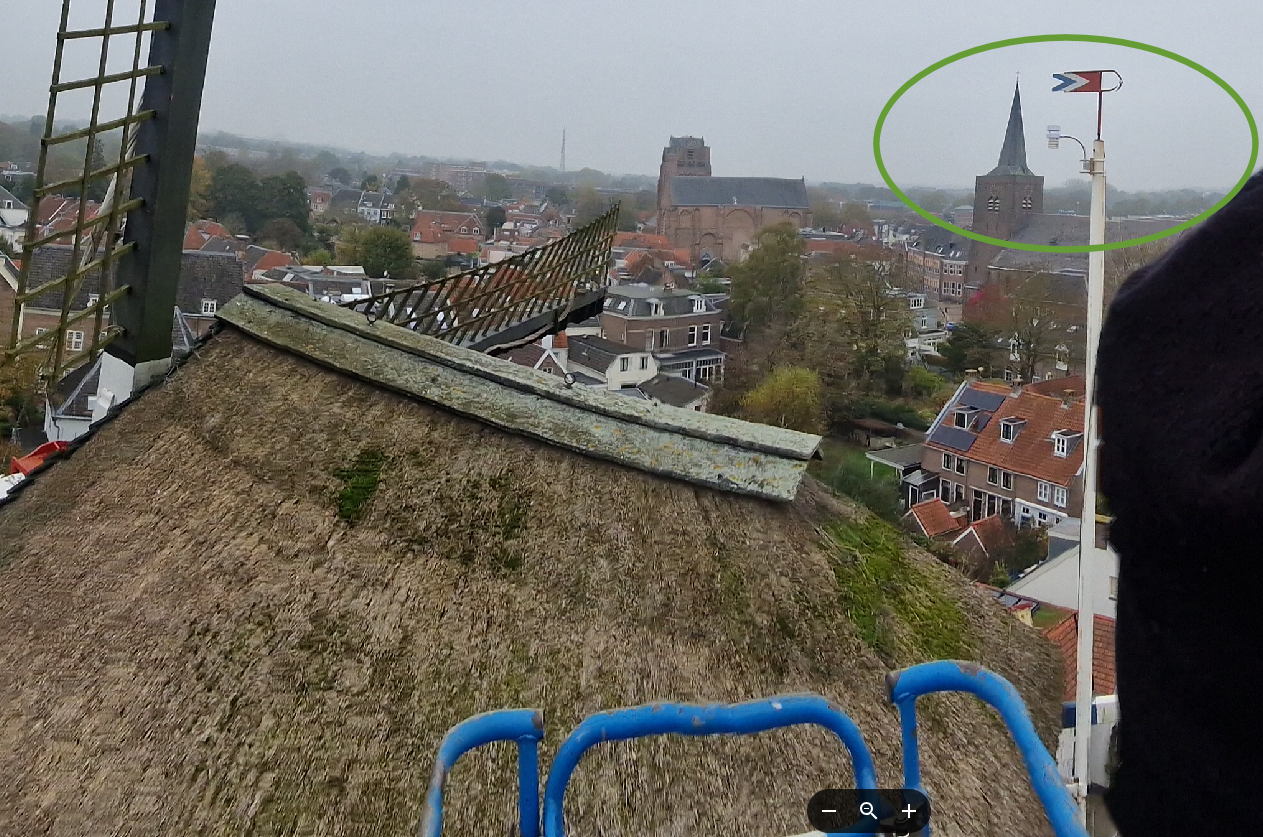
The height of the anemometer (wind speed and direction) is around
25m from the road level (gallery: 9m + space gallery and sail: 1m
+ sail length:12m + flagpole: 3m) and some 28m from the river's
floodplain level.
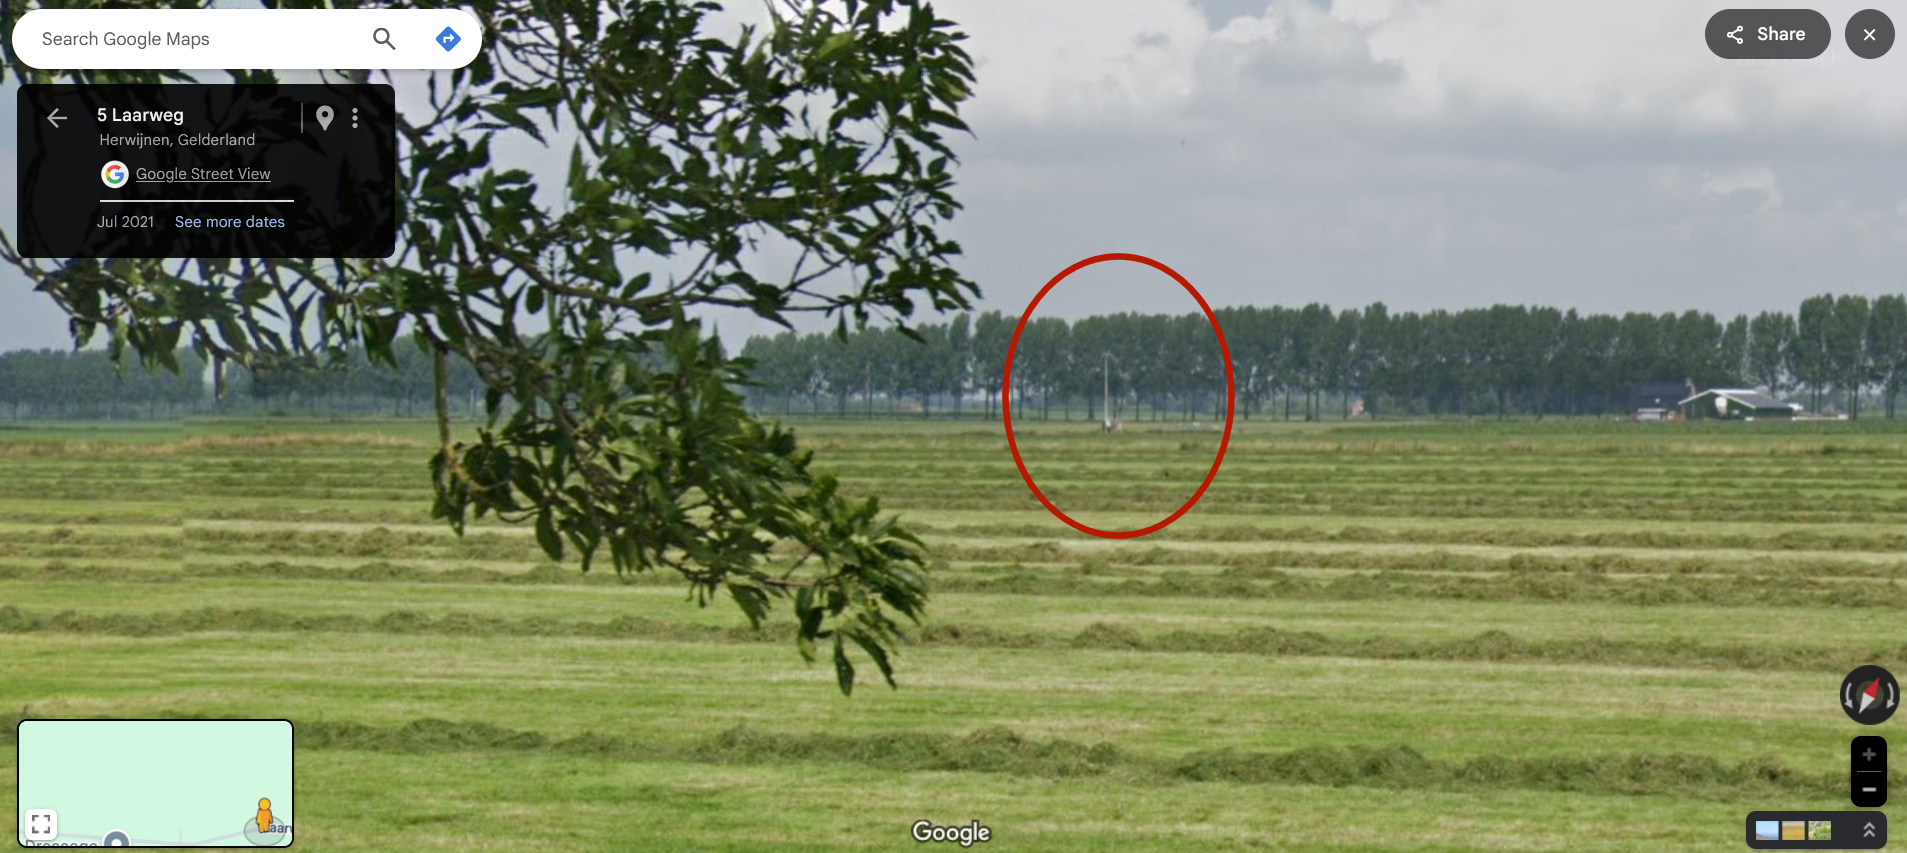
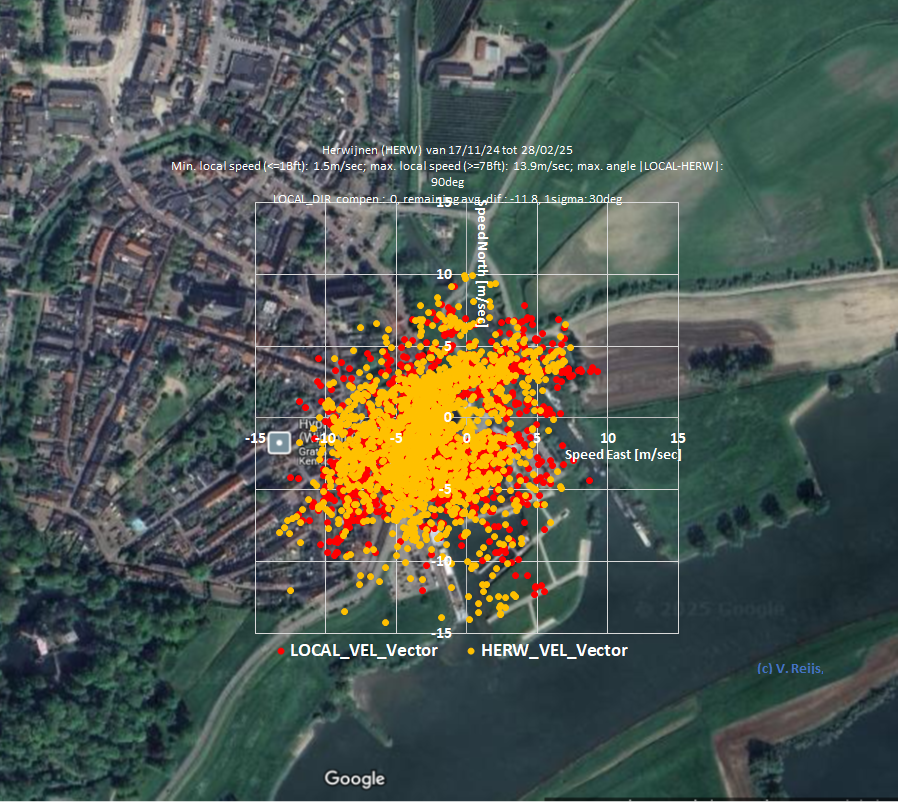
Rijn en Lek is in a very open environment (certainly at shaft
height). The trees at the castle Duurstede estate in the west and
the two churches in the NNW can have influence. The rest is very
open in a large portion of the wind rose (N to SW), and will have
a likely z0m=0.03m (the river-delta), while the rest
(town direction) might be z0m=0.5m or 1m.
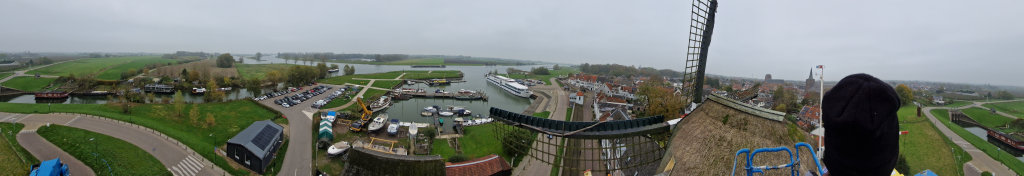
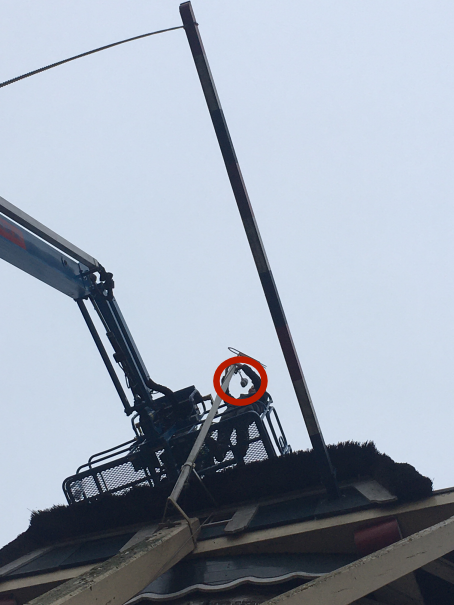
A panorama picture made by Justin Coombs ((c) 2024)
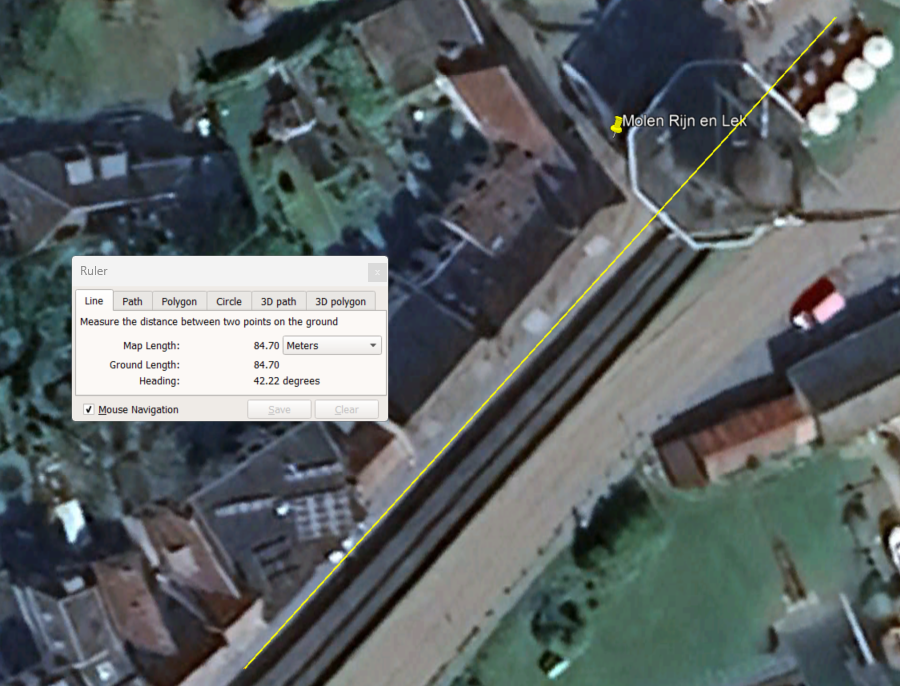
| Met.
station ID |
Location |
Distance
with Rijn en Lek |
| EHDL |
Deelen |
35 |
| HERW |
Herwijen |
19 |
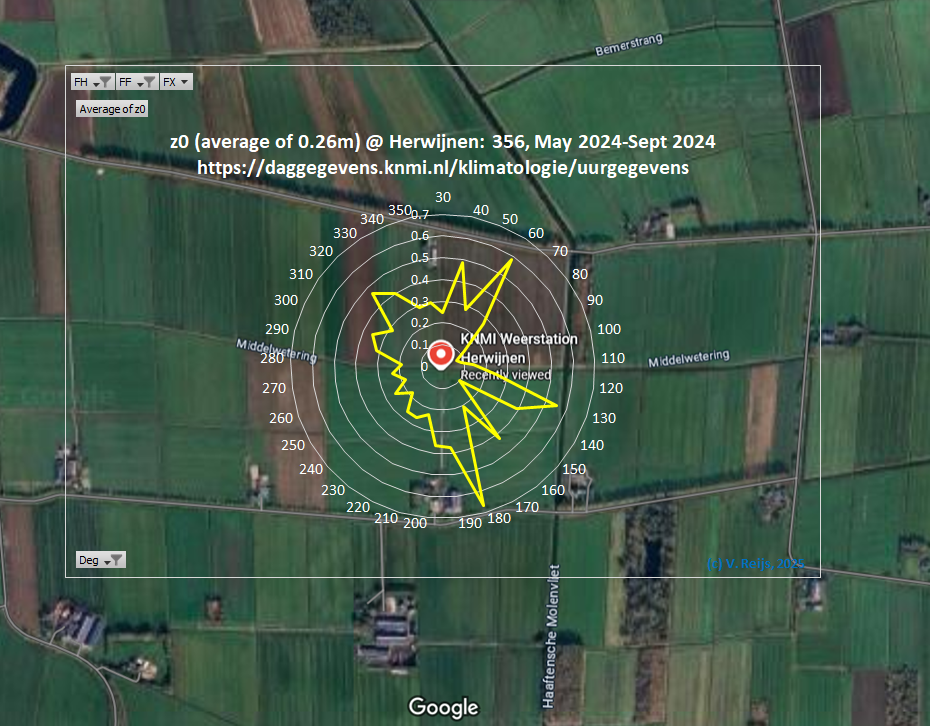
KNMI-Cabauw stands in between rough environment [Davenport, 2000]. So a likely z0=0.25m.
Using wind and gust speeds (hour averaged) at
Herwijnen [Benschop 2005b Chapter 1] we get an z0
with an average around 0.26m (during leafed period:
May-September):
The average wind speed over the year can be used to normalise the
meteorological stations' wind speed towards the Wijk bij Duurstede
location:
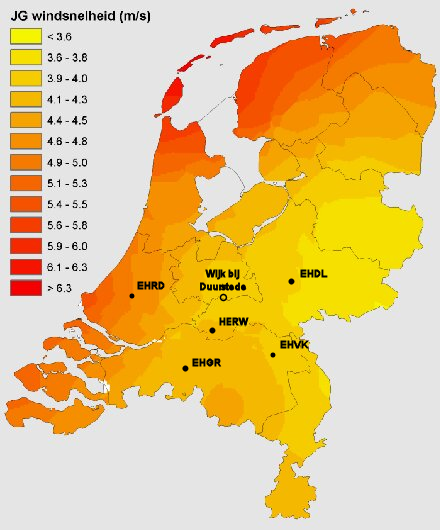
The yearly average wind speeds are [m/sec]:
| Wijk
bij Duurstede |
EHDL |
HERW |
|
| Speed@10m [m/sec] |
3.7 |
3.55 |
3.8 |
| Normalise speed@10m [-] |
1.04 |
0.97 |
|
| Normalise
speed@25m [-] |
1.27 |
1.18 |
As the wind speed is referenced to a height of 10m, we need to
determine the speed at the mill's anemometer height (which is 25m)
to be able to compare like with like.
It is assumed the roughness length at meteorological stations is z0a=0.24m
and assuming the roughness length at the mill's anemometer is z0m=0.39m.
The speed at anemometer height (25m) will
have an additional increase of [Beljaars, 1979, page 4]:
ushaft=u10*(ln(60/0.24)/ln(10/0.24))/(ln(25/0.39)/ln(60/0.39))
= u10* 1.22
Remark: The z0m
is not really known as there might not exist an logarithmic
ABL at the mill (now used a z0m=0.39m).
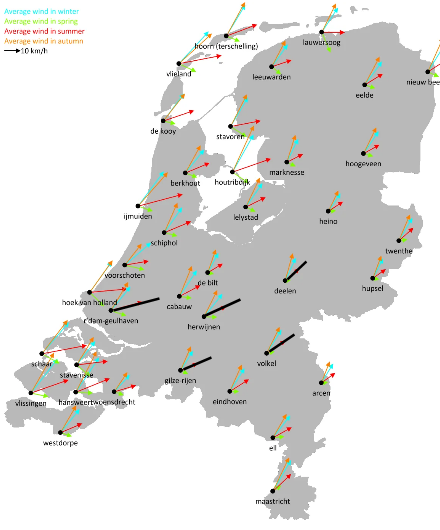
The average wind direction over the summer (red / black arrows)
and winter (blue) can be used to normalise the meteorological
station's wind direction towards the Wijk bij Duurstede location:
| Wijk
bij Duurstede |
EHDL |
HERW |
|
| Summer direction [deg] |
245 |
227 |
246 |
| Normalise summer
direction [deg] |
0 |
+18 |
-1 |
| Winter direction [deg] |
218 |
203 |
219 |
| Normalise winter
direction [deg] |
0 |
+15 |
-1 |
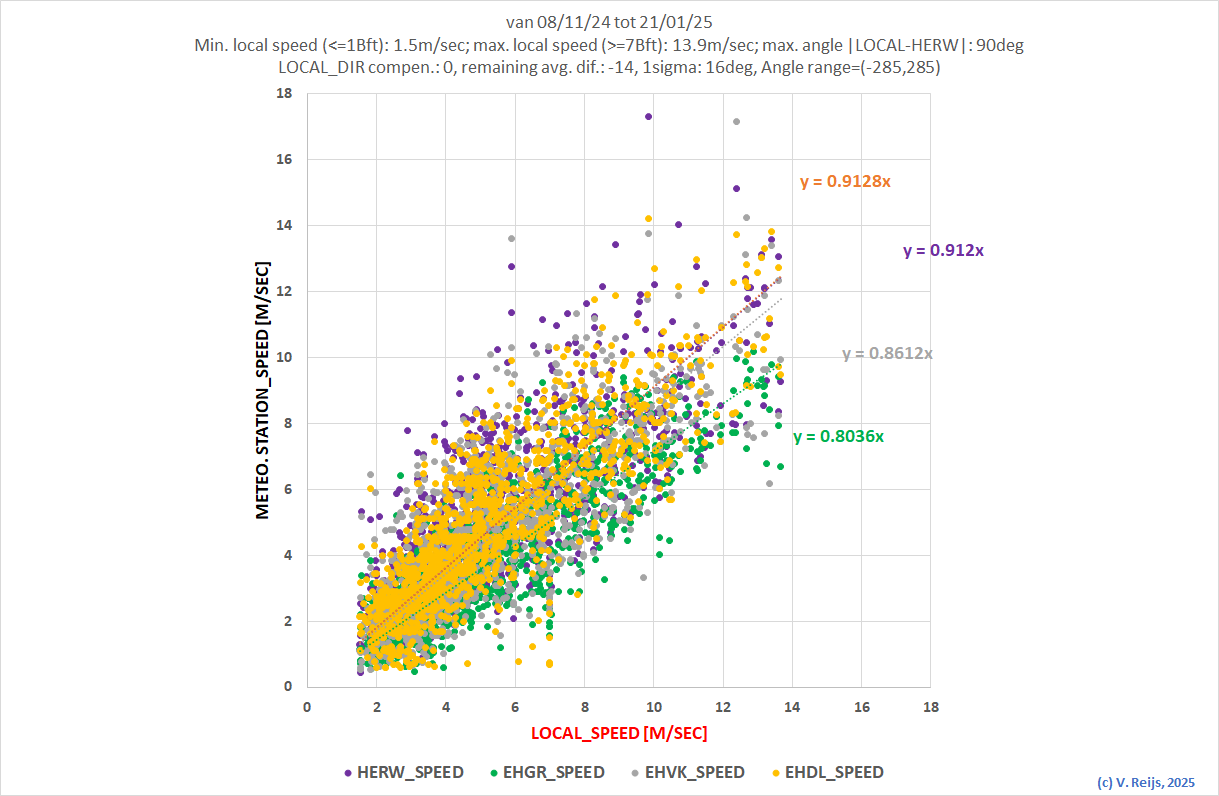
The wind direction of the meteorological stations can be seen
below with the wind direction at Rijn en Lek mill on the x-axis
(for 1Bft upto and including 7Bft). The meteorological station's
speeds have been compensated for the height of the anemometer and normalised
with the average
yearly wind speed.
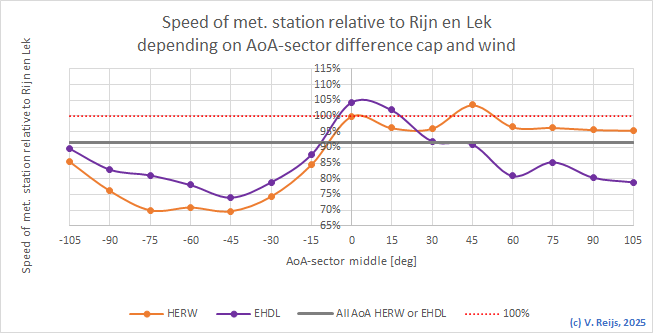
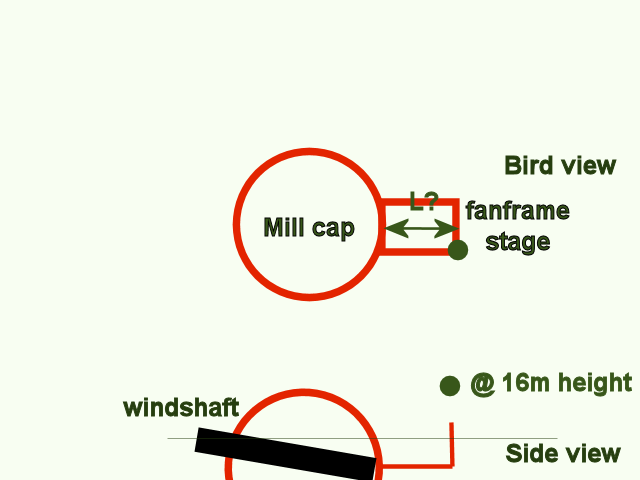
What is to be expected when looking at the wind speed effects
around the anemometer, which is 2m above the mill cap and some
25cm in front of the flagpole?
The wake of the cap will have influence, by increasing or decreasing the windspeed at the anemometer. The following effects could happen (negative angle of attack [AoA] means a backed wind and positive AoA means veered wind):
The relative wind direction of the meteorological
stations can be seen below (relative to the wind direction at Rijn
en Lek mill). The meteorological station's directions have been
compensated for the average winds direction in winter.
Rijn en Lek wind direction (on x-axis) has been compensated for
the alignment error.
The distribution of directions can be seen below:
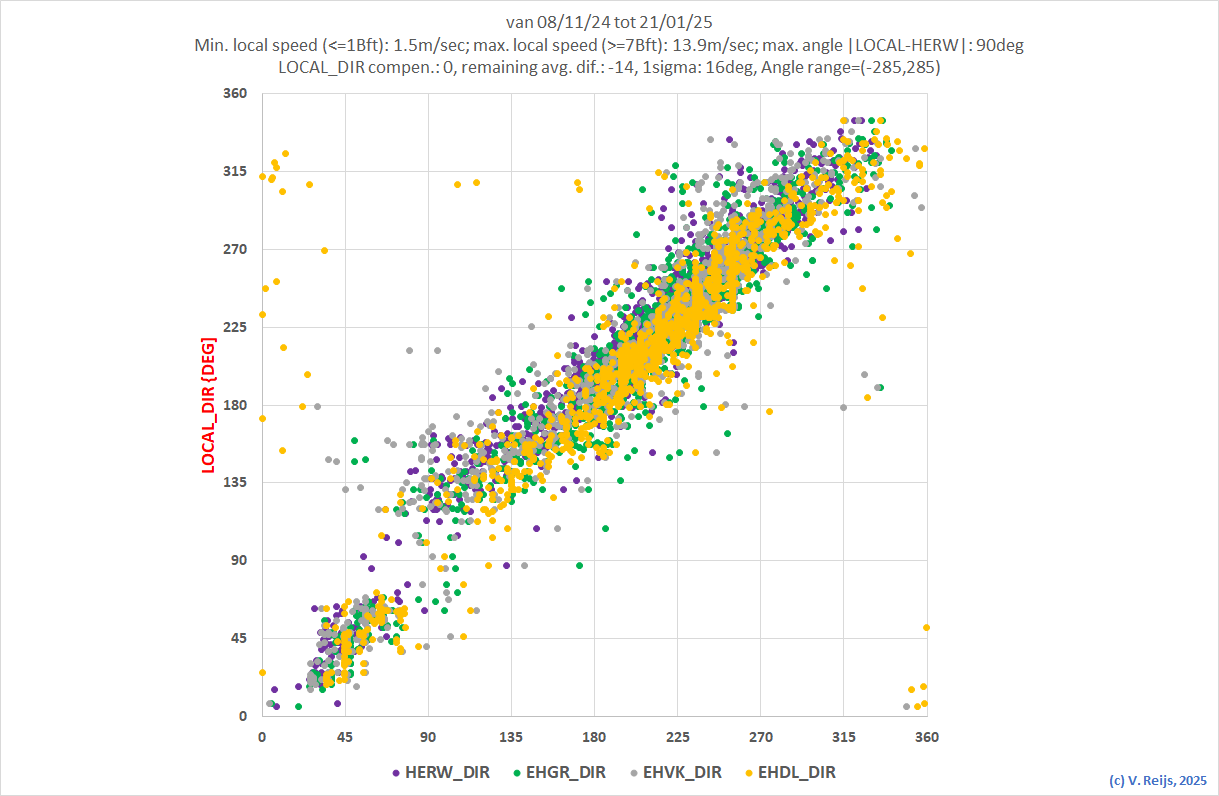
The standard deviation of relative meteorological
stations' direction is some 25deg. Assuming that the standard
deviation of the meteorological stations' and anemometer's wind
direction are similar, they are both around 15deg.
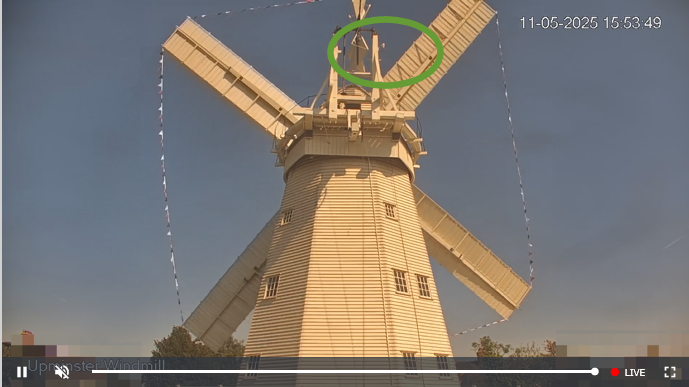
From 24/11/2024 05:00 until
25/11/2024 01:00 one sees a slowly moving direction of the mill
cap (from 198 to 204deg), while no manual turning happened (in the
red circle):
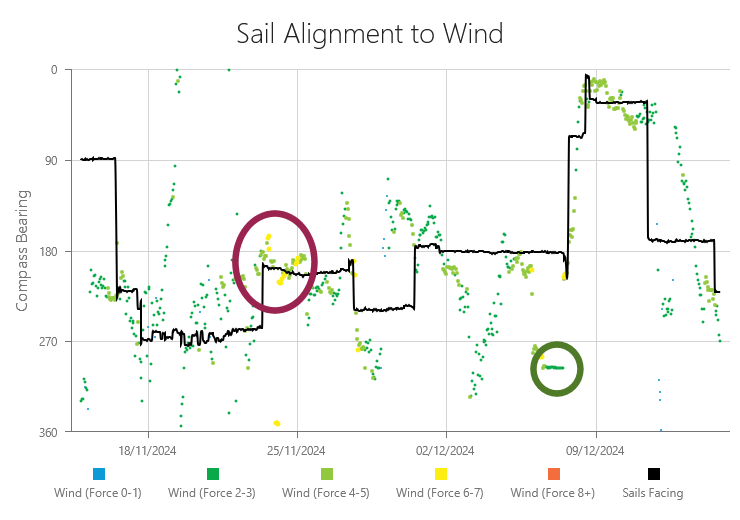
This is at the time that storm Bert
(in particular its warm sector) raged over The Netherlands.
Explanation could be: a) the cap was
pushed to the side of the curb due to the wind force or b) the
magnetometer calibration process caused this.
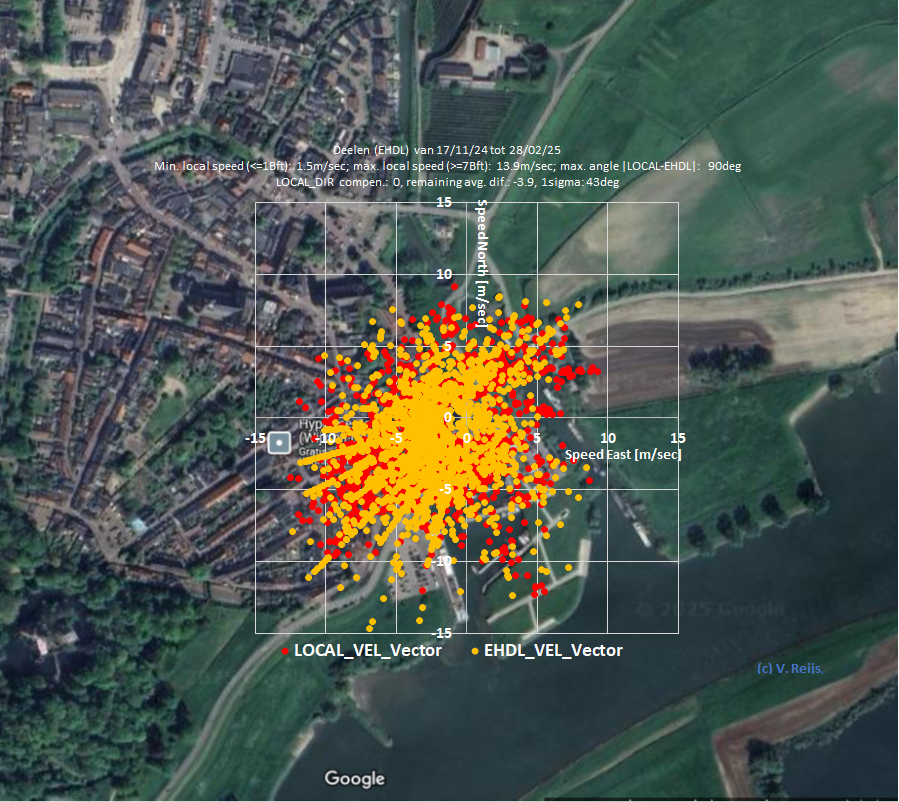
KNMI meteorological stations Deelen and Herwijnen (orange dots,
looks that the majority has a resolution of some 5deg) has been
used below, as these two have the smallest difference with wind
direction at Rijn en Lek (red dots, 1deg resolution) and they are
close meteorological stations to Rijn en Lek.
| Herwijnen, HERW | Deelen,
EHDL |
 |
|
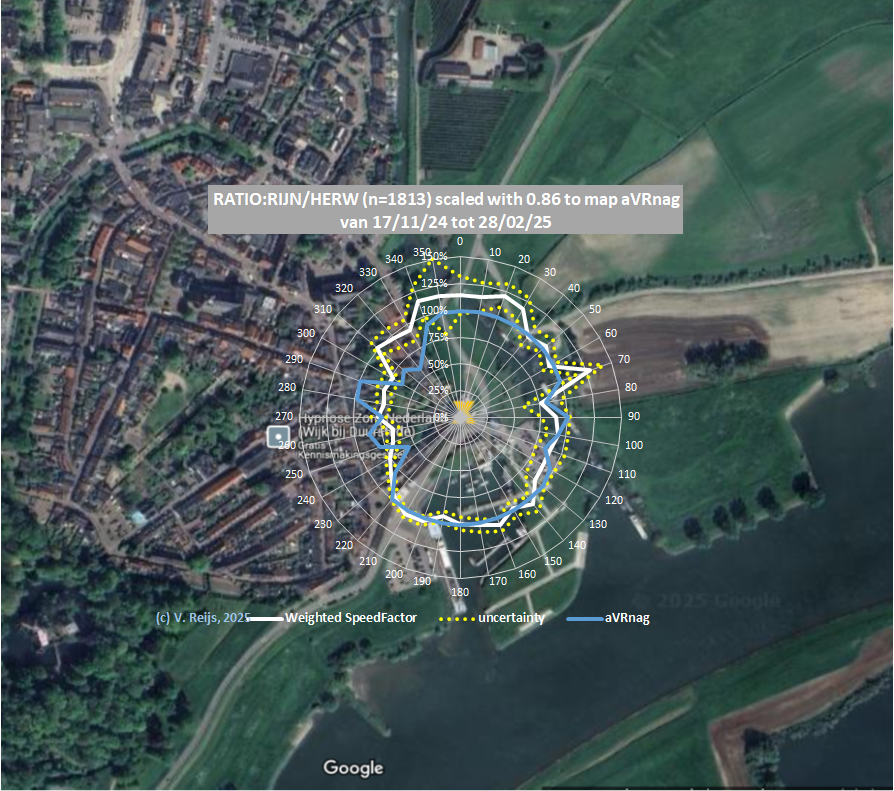
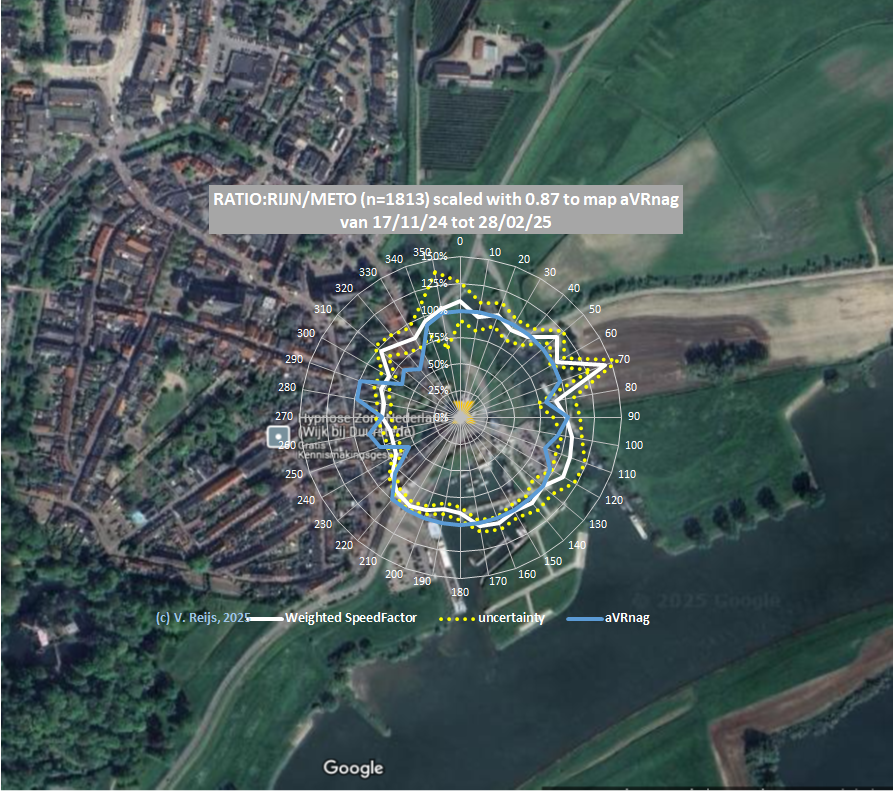
The looks to be some realistic mapping between Rijn en Lek
(LOCAL), Deelen (EHDL) and Herwijnen (HERW).
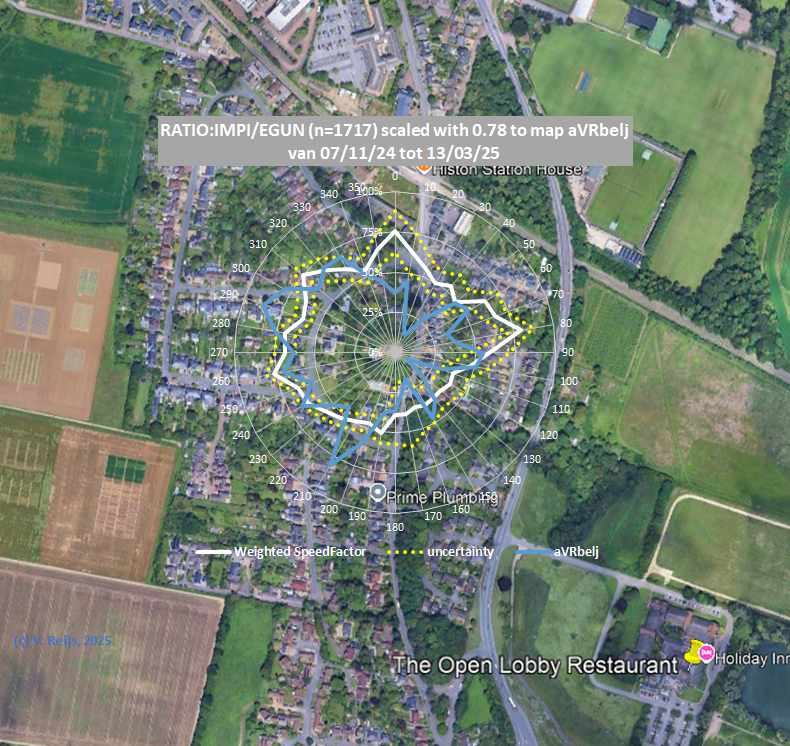
The above compensated direction and wind speed data have been
used. The speedfactor has been derived by dividing the Rijn en Lek (LOCAL) anemometer's wind
vector by the meteorological (HERW or EHDL) station's wind vector.
From these, the (non-weighted) average speedfactor magnitude per
10deg sector has been derived.
<right click a picture, to see a larger version in another browser window>
| Rijn en
Lek&HERW |
Rijn en
Lek&EHDL |
Rijn en
Lek&Open-Meteo |
 |
 |
 |
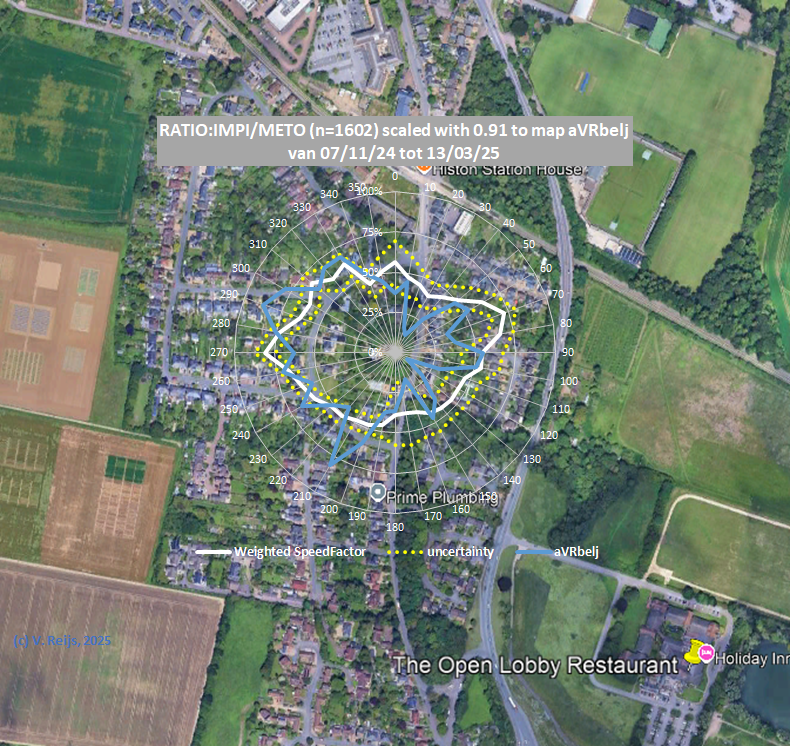
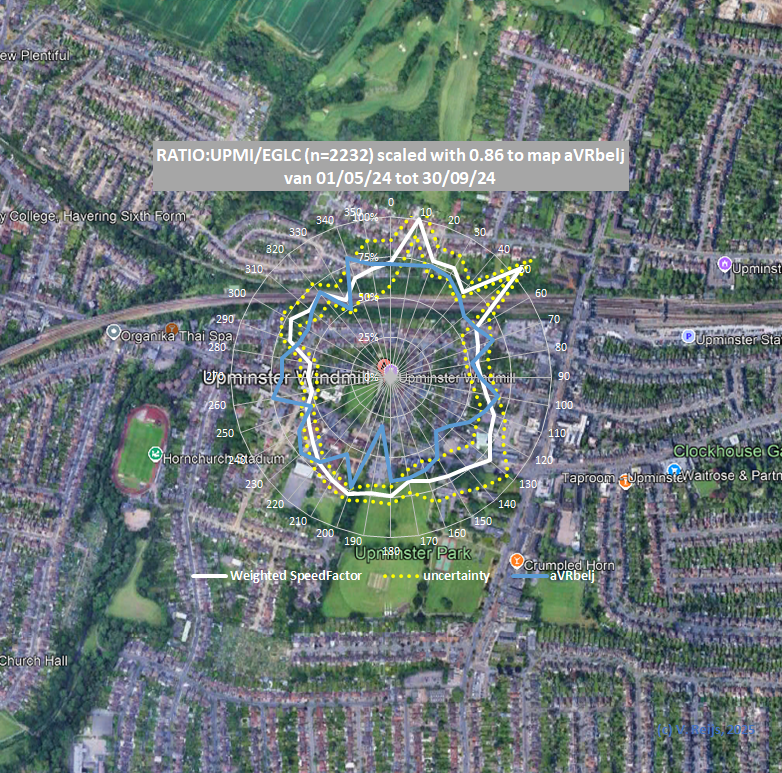
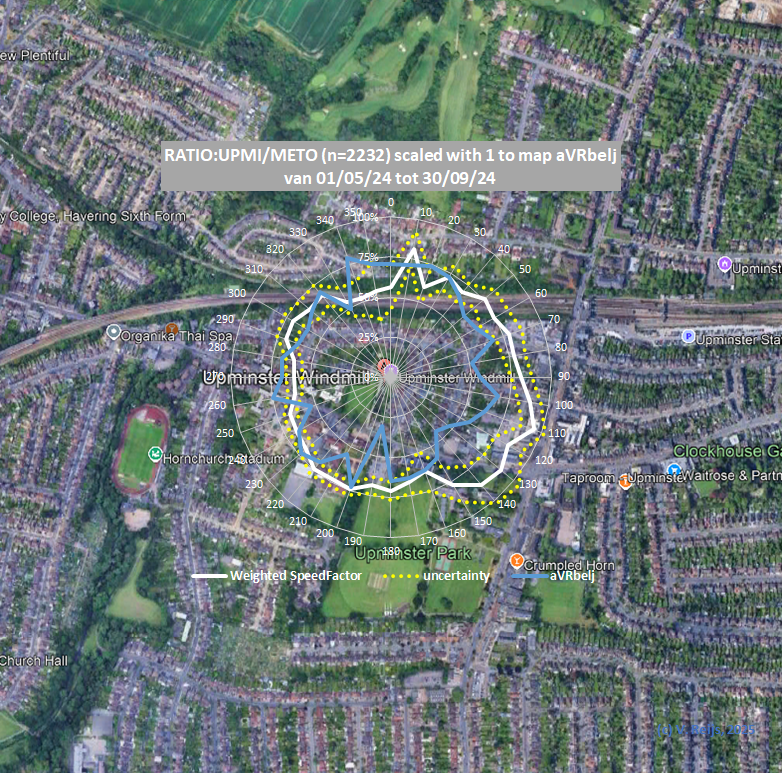
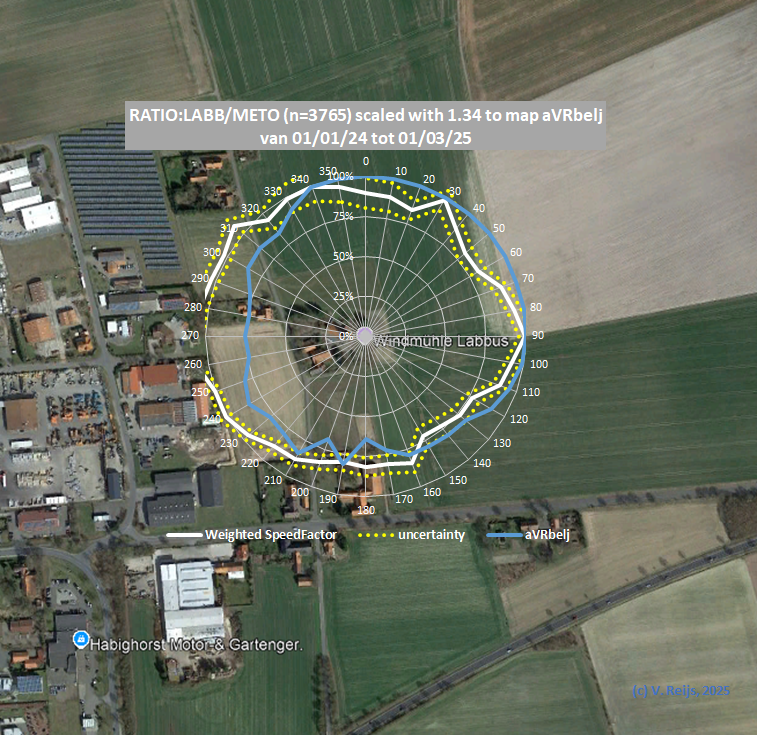
| Mill |
Impington
(old location) |
Impington
(present location) |
Upminster |
Rijn
en Lek |
Labbus |
De
Middelste Molen |
Pendrechtse
Molen |
| Location anemometer |
 |
 |
 |
 |
 |
 |
2.5-3m above ground level, on a short pole fixed to the small shed. |
| Scale factor |
NA |
0.91 |
1 |
0.87 |
1.34 |
NA |
NA |
| Impington&EGUN |
Impington&Open-Meteo |
Upminster&EGLC |
Upminster&Open-Meteo |
Labbus&Open-Meteo |
 |
 |
 |
 |
 |
| Mill |
Open-Meteo Latitude |
Open-Meteo Longitude |
Environment Open-Meteo point |
z0a |
| Impington |
52.24° | 0.12° | quite open landscape, 400m from Impington and Cambridge |
0.65m |
| Labbus |
52.68° | 8.84° | just outside Sulingen
village |
0.41m |
| Upminster |
51.56° | 0.24° | London suburb |
0.93m |
We need to remember that a stable calibration of the magnetometer
has now happened for some 17 weeks (Nov. 8, 2024 to March 1,
2025). Longer averaging might change the results in the future. If
we need to have seasonal numbers, a two year period migth be
needed.
There were battery problems with one or two magnetometers between
21 January and 17 February 2025.
<more to be added>