Thom's terrestrial refraction observations
Thom has done some 600 observations of refraction during day and
night time:
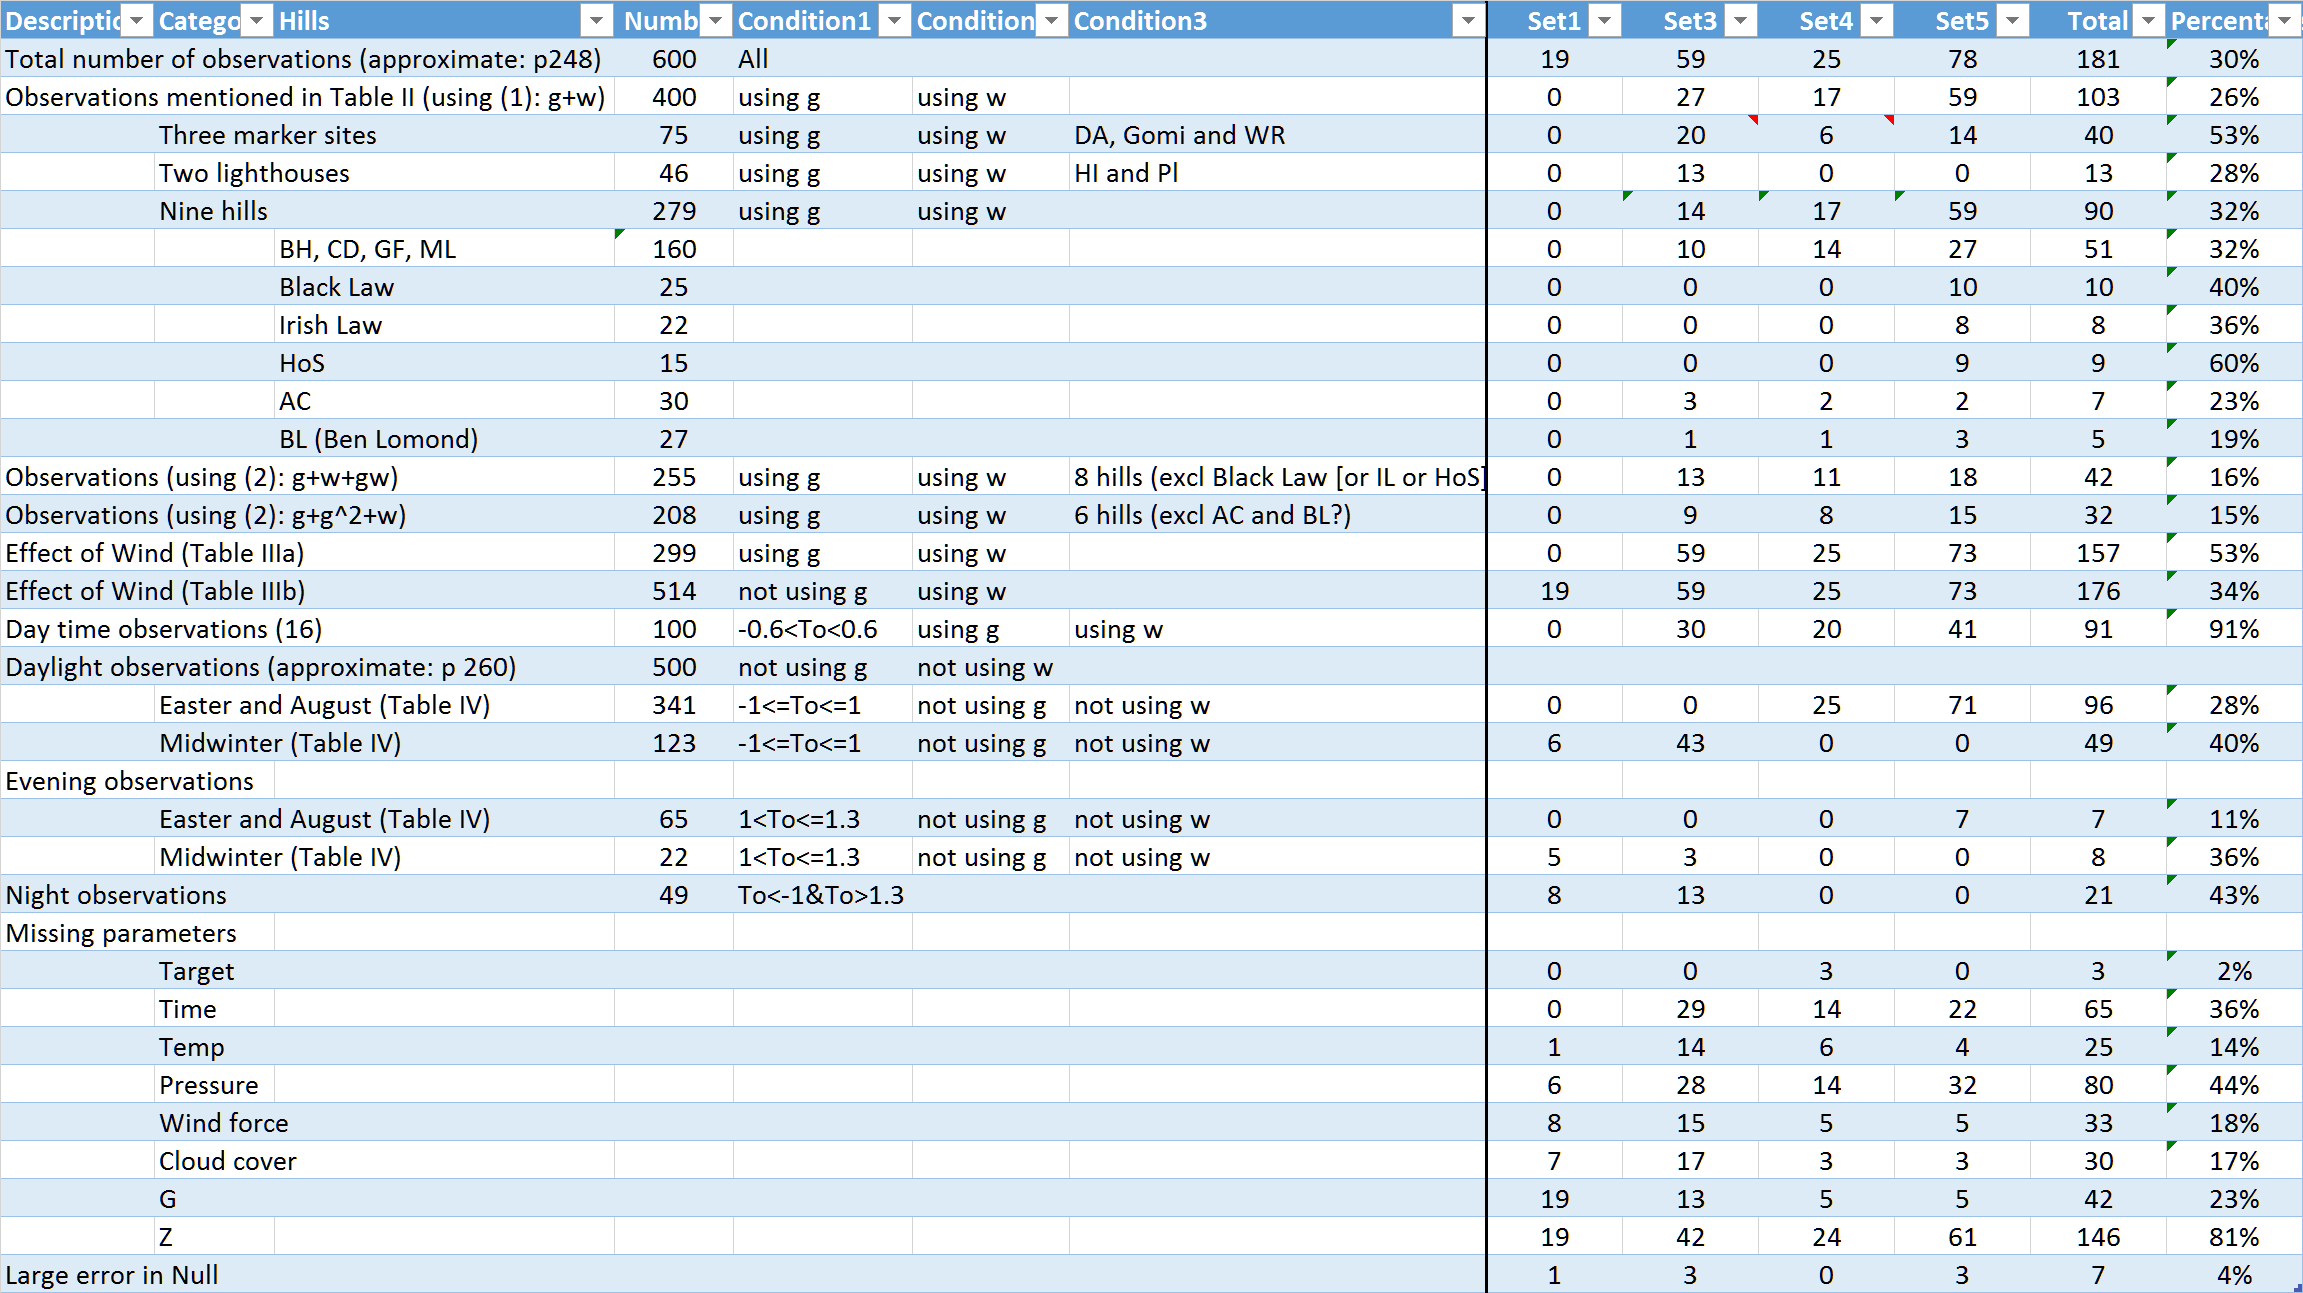
The left part of the table provides an overview of observations
evaluated in Thom's article (1958) and right part shows how many
observations have been transcribed from Thom's notebooks (MS/430/27
and MS/430/64), which were found and copied by Thomas Gough (pers.
comm. 2017). Thom recorded many parameters around his apparent
altitude measurements for terrestrial refraction; not many people
did similar recordings.
Issues around transcribing
There are a few issues that were encountered while transcribing:
- Thom observed several target from The Hill, which is at an elevation of
148m above sea level and at 4.52727 West and 55.70659 North
(WGS84).
- Thom did not observe objects at apparent altitudes due to vast level
surfaces. It is expected these would have a larger
influence from the temperature gradient near ground level.
- At this moment four sets of observations have been transcribed
(in total 181 observations). The calculations around these
transcriptions were performed using ARCHAEOCOSMO (and
Excel).
- It might be that some 35% of the observations are in the
retrieved notebooks (at Historic
Environment Scotland in Edinburgh).
- It looks Thom has used two different (type of) theodolites:
one which reads apparent altitude values around 0 (or 360) or
180 (Set 1 and 5) and one which reads apparent zenith angles
around 90 and 270 (Set 3, 4).
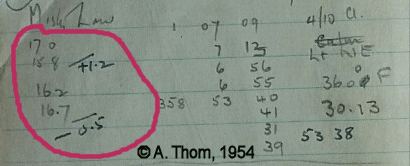
- Thom wrote numbers in front of his
theodolite apparent altitude readings (normally close to 16 or
116). See below numbers within the red outline (Thom, MS/430/27,
1954)
Not clear yet what they mean: they could have a relation to the
bubble (1958, page 249). No bubble corrections have yet been
done. Thom determines a bubble correction in MS/430/64. But is a
correction needed if both direct and
reverse measurements are taken?
It is important to understand this, as it might be able to
systematically improve the results. If you have ideas how
to solve this uncertainty, let me
know.
- Thom abbreviates theodolite apparent altitude readings.
Sometimes 89, 179, 269 and 359 are mostly written as '9'.
Similar with 90, 180, 270 are 360: are written as 'nothing' or
as '0''. This can be confusing. When one knows the theodolite
target one can deduct how to read it!
- Thom records the follow parameters around the altitude
recordings: target, date, time, temperature (F), pressure (Hg),
wind direction, wind force, cloud cover, G (related to
temperature gradient?), Z (zero/reference of G?) and bubble(?).
Some of these parameters might not be recorded for an
observation: between 2% (target) and 81% (Z) are seen to be
omitted.
- The most important parameters to note for the terrestrial
refraction are: time and wind force, and both are missing up to
40% of the observation (sometimes both are missing for the same
observation). In most cases a reasonable inter/extrapolation
could be made, so the effect of the omissions is not
significant.
- G an Z parameters are not recorded for Set 1. Five observations in Set 5 have a serious
error in G.
- It is not yet 100% sure how to
interpret the G and Z parameters. Are these related to
temperature gradient and if so are this numbers derived from
thermocouples with a deflection meter or potentiometer method (ASTM, 1981, Chapter
6).
Thom wrote about this (1958 page 250):
... two thermocouples were made and placed one
2.5 ft. above the ground and the other 25 ft. higher.
[...] The thermocouples were opposed and the e.m.f. measured
on a high resistance galvanometer.
From this is has been deducted that Thom used the deflection
meter method. And in his notebook (Thom, 1956, MS/430/64) the
following is mentioned:
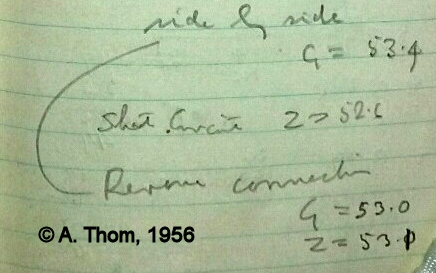
From the above picture we can read:
-
'side by side'
For calibrating? Did he place the two opposing
thermocouples beside each other, aka at the same
temperature?
A value is mentioned for G.
-
'Short Circuit'
For reference/zero? Did he short circuit the two opposing
thermocouples to get a zero/reference value?
A value is mentioned for Z.
-
'Reverse connection'
Did he reverse the connection to the two opposing
thermocouples or did he reverse each of the thermocouples?
Values mentioned for G and Z.
- Another text from the notebook
(MS/430/64) that could reveal something from the G and Z method:
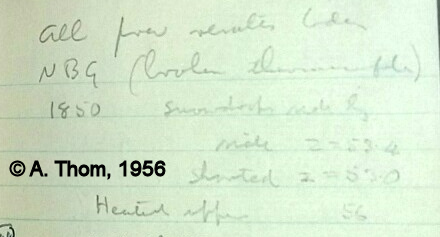
It looks to say: 'All found results ??? NBG
(broken thermocouple)'.
'NBG' is something related to type of thermocouple or type
of connector head?
The above text was written after several exceptionally low
Gs (around 25) were noted. The NRI Stability Class does not
reveal such a very low Temperature Gradient. 25 sounds
almost to be half of the 'normal' G value (around 50): so
one thermocouple 25 and two around 50: could this say
something about the method?
-
Another text that could help:
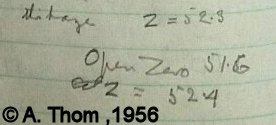
So there is a difference between 'Open Zero'
and 'Z' ('Short Circuit' or 'shorted').
- Comparing the G (blue), Z (green),
DeltaGZ (G-Z: gray) and Temperature
Gradient from NRI's Stability Class
(yellow) is done in the below graph for Set 3:
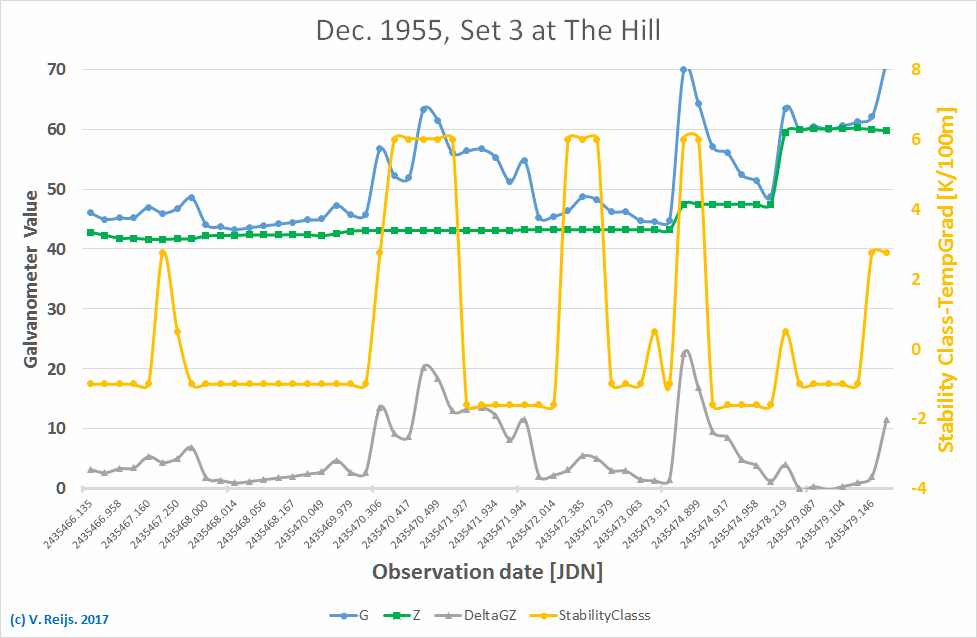
Remember that Z values were missing in 70% of the observations,
so they were interpolated (hopefully that is no problem as they
looked quiet stable (except for two major jumps; between two
different days). The gray line (derived proxy DeltaGZ for the
temperature gradient?) is perhaps somewhat followed by the
theoretical Temperature Gradient from NRI's Stability Class (based
on: Sun's altitude/insolation, day/night, cloud cover, cloud
height and wind speed: the high values of Temperature Gradient
are reached during the stable night NBL) periods: before '1hour
after sunrise' and after '1 hour before sunset'.
Interesting to see that the measured G does not become negative
in this Set 3, while one would expect this to happen during the
day times. But this happened also during the measurements of the
Temperature Gradient at Skerries,
Ireland (by the webmaster).
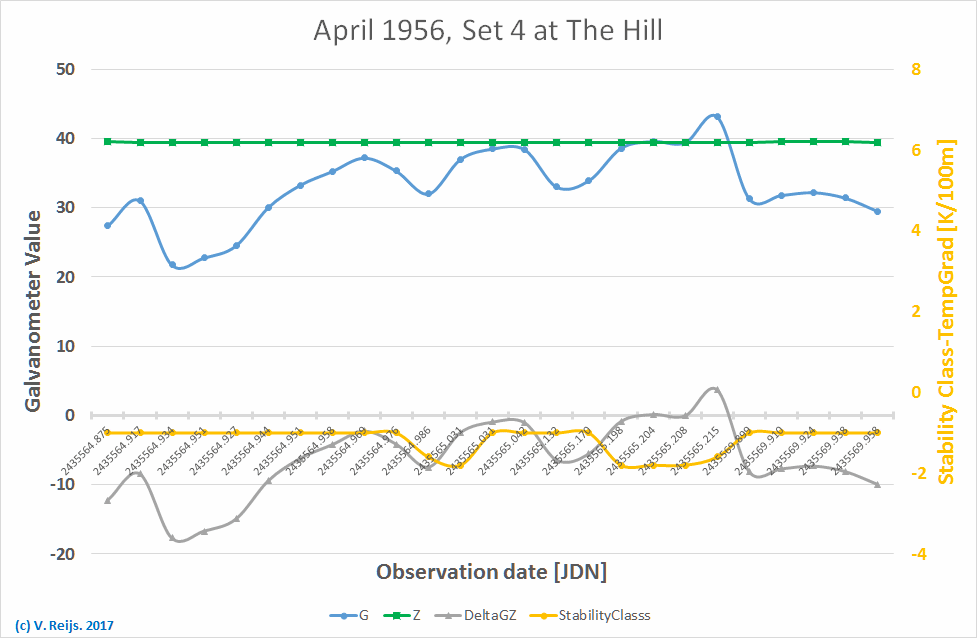
For Set 4 (see below graph); G (blue) is most of the time below
Z (green), so it looks G can become negative. DeltaGZ (gray) is
followed somewhat by the NRI theoretical Temperature Gradient
from Stability Class (yellow):
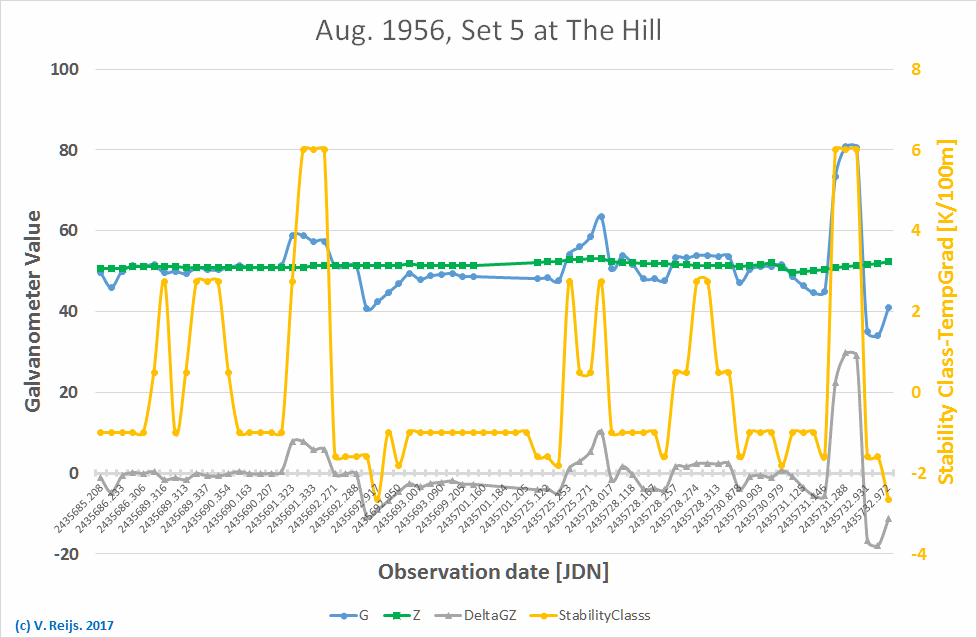
Here is the overview from Set 5:
It is important to fully understand the determination of the G
and Z, aka Thom's Temperature Gradient. If you have ideas
how to solve this uncertainty, let me
know. This is another possible way
to derive it!
- Thom measured the apparent altitude from
The Hill by using the direct and reverse face of the theodolite.
The average results of these two face measurements should for
all observations be the same. In 95% of the observations that is
true (for both [type of] theodolites), at the standard deviation
is around 15" (1 sigma). In some observations there seems to be
an error of 30', this could have been a scale-reading error. In
others no 'obvious' error can be found, so these observations
have been removed from the pool.
- For the three Mark locations (I, II, III) in Thom (1958), no
coordinates and elevations have been mentioned. The distances
from the Theodolite are know (Thom, 1958, 253). Was able to get
an approximate location for Mark I and III using HeyWhatsThat, but not for Mark II.
- The location of the Theodolite has also been determine by
using a Simplex optimisation for the azimuth measurements
mentioned in MS/340/27. This Theodolite location is some 40m
from the location provided by Thom (1958, page 249). Thom's
Theodolite location has been used as the reference.
- The Terrestrial refraction
coefficient has been determined for the targets evaluated in
Thom (1958). The below graph shows these Terrestrial
refraction coefficient (including their variations):
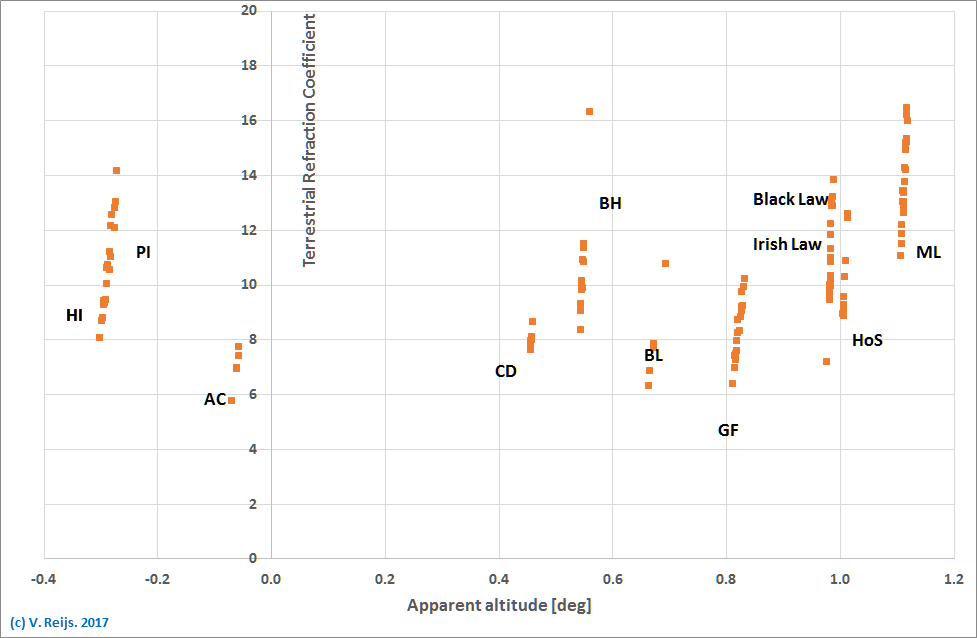
Even though it looks remarkable constant, one could see ML and
AC to be somewhat out-layers, but all is still not that far
off when taking into account the variation.
- If the
observations are analysed using the formula
TerrRefracCoeff=A+B*Temperature Gradient+C*Beaufort.
The is formula (1) in [Thom, 1985], furthermore the
Temperature Gradient is [for now]
assumed to be based on 20 DeltaGZ units =
1°F. When optimising this formula for some 120
observations, we get:
A=10.8
B=20 (if Temperature Gradient is in F/ft) or 0.11 (if
Temperature Gradient is in K/100m)
C=-0.25
The B value is somewhat mapping Thom's B values (1958, Table
II). Below is the mapping of the formula-results
(orange) on the actual observations (blue):
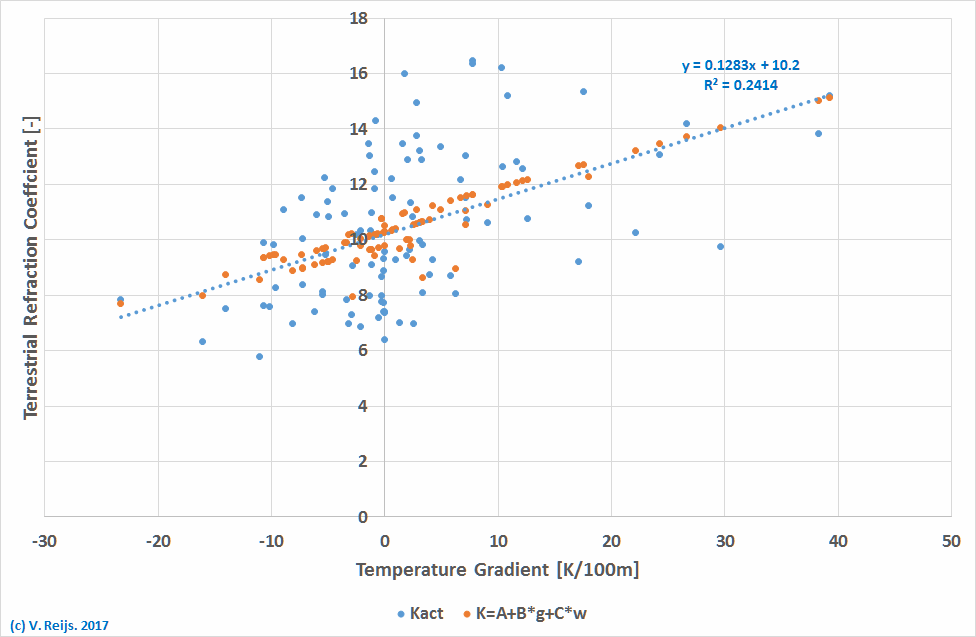
The inclusion of Beaufort does not contribute significantly to
the match. Beaufort is also not an independent variable
compared to Temperature Gradient (as can be deducted from the
definition of NRI Stability
Class).
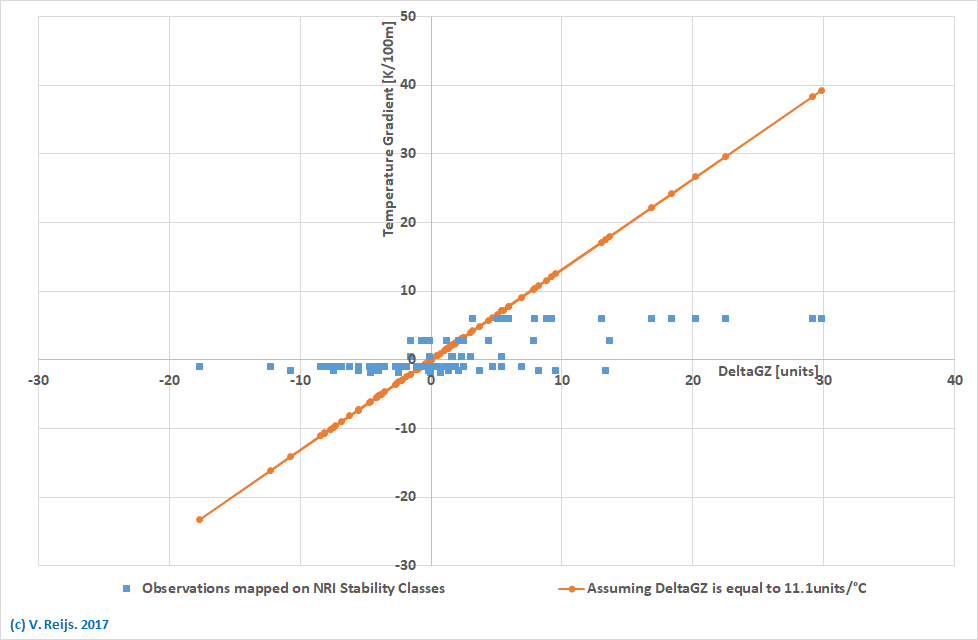
- In the above formula
it was assumed that the DeltaGZ (difference
of Thom's G and Z) represents
20units/°F.
The 20units/°F
was derived by looking what the highest and lowest
DeltaGZ were and optimally mapping them on the
highest (+0.18°F/feet)
and lowest (-0.12°F/feet)
Temperature
Gradient mentioned by Thom (Thom, 1958, page 250).
Is it a coincidence that this optimally mapping
becomes such a nice number '20'?
In below graph the orange
line uses for DeltaGZ this 20units/°F
(or 11.1units/K).
The blue squares represent the atmospheric conditions (Sun's
altitude/insolation, day/night, cloud cover, cloud height and
wind speed) mapped on Temperature Gradient
determined by using NRI Stability Class:
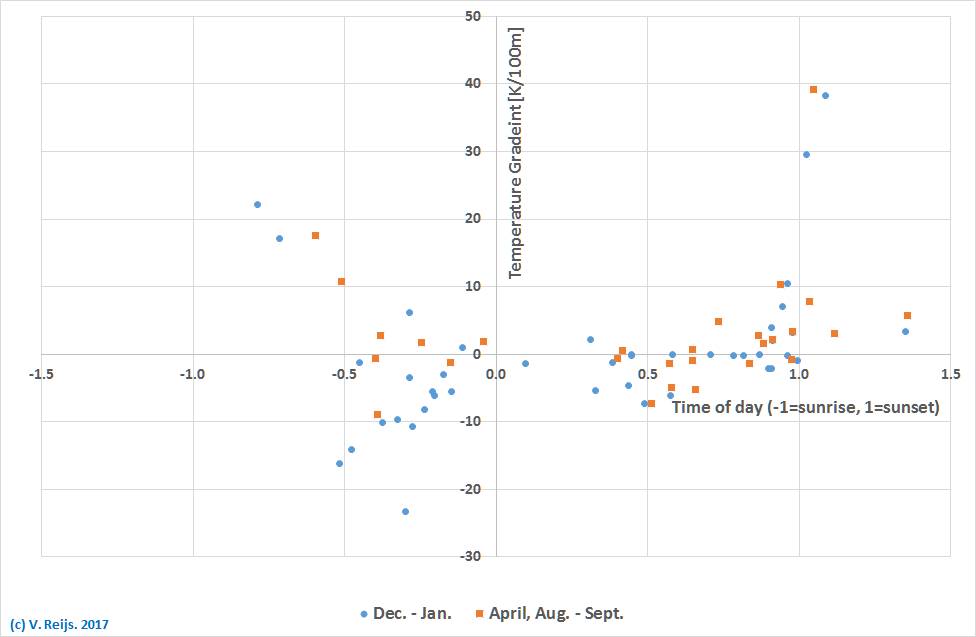
- If we assume that the
Temperature gradient is close to the above, the distribution
of temperate gradients over the day (with sunrise is -1 and
sunset is 1) can be seen for April/Aug/Sept (equinox) time
(orange) and Dec (winter solstice) time (blue) in below figure
for The Hill. This should map on Fig 7 in Thom (1958, page
262).
- The variability of the
temperature gradient mentioned in several sources, can be seen
in this link.
- Thom's evaluation (1958) is mainly
around targets with a positive apparent altitude. The two
lighthouses, that have negative apparent altitudes, are excluded
from the main evaluation, because according to Thom these
targets are "in a class by themselves" as "that the rays to the
lighthouses ran low over the sea for many miles".
And even the lighthouses (PI and HI) have relative high
elevation (some 40 meter above sea level). All other targets
were hill tops well above sea level (at least 340m). Ailsa
Craig (AC) is a 340m high mountain in the sea (apparent
altitude of around -0.065deg) which is included in most of
Thom's evaluation.
- Anyway: Thom did not observe objects at apparent
altitudes due to vast level surfaces (where the light path
would pass at low heights from the ground). It is expected
that observations touching a vast level surface would have a
larger variation due to larger temperature gradient near
ground level.
- The average
Terrestrial refraction Coefficient is 10.5 (derived from
observations in above
picture), which maps on sun rise/set
when using Thom's
terrestrial refraction formula.
Conclusion
Thom's evaluation can certainly not be mapped on Negative Apparent Altitude
Refraction (NAAR), some can be mapped on Around Zero Apparent Altitude Refraction
(AZAAR), Thom himself evaluated mostly the Positive
Apparent Altitude Refraction (PAAR) observations. Thom also did
several Positive Altitude Astronomical
Refraction (PAAR) observations of stars, but these were not
evaluated in Thom (1958) or this webpage.
As refraction is influences mostly by a high Temperature
Gradients, we need to find situations where this happens. High
Temperate Gradients happen near ground level, aka low heights.
And both in terrestrial and astronomical environments this
happens when one gazes over a vast level surface, where
the light path grazes over the far away landscape (with a
possible high Temperature Gradient).
As soon as one gazes over a terrestrial object it is normally
higher up and thus the Temperature Gradient is lower.
The sites which Thom removed (the lighthouse observations:
Pl and HI), are included in the evaluation on this web page and
thus extending the range into the AZAAR environment. No targets
were removed (except Mark I, II and III: which don't have
coordinates and elevations) as all had similar theodolite accuracy
(as derived by Thom's direct and reverse observations).
Still need to verify the two possible uncertainties of the
measurement methodology: temperature
gradient and bubble readings. If
you have ideas how to solve these uncertainties, let me know.
References
ASTM Committee E-20 on Temperature Measurement. Subcommittee
E20.04 on Thermocouples. 1981. Manual on the use of thermocouples
in temperature measurement (ASTM).
Reijs, Victor M.M., 2017a, "Geniet: Thom's terrestrial refraction
observations", http://www.archaeocosmology.org/eng/Thom-refraction.htm
Reijs, Victor M.M., 2017b, "Geniet: Temperature gradients at
Skerries", http://www.archaeocosmology.org/eng/TempGradientSkerries.htm
Thom, Alexander. 1954. "Notebook.", MS/430/27, Edinburgh: Historic
Environment Scotland.
Thom, Alexander. 1956. "Notebook.", MS/430/64, Edinburgh: Historic
Environment Scotland.
Thom, Alexander. 1958. 'An empirical investigation of atmospheric
refraction', Empire Survey Review, Vol 14: pp. 248-62.
Thom, Alexander. 1971. Megalithic lunar observatories (Oxford
University Press).
Acknowledgements
I would like to thank people, such as Thomas
Gough, Stephen
McCluskey, Marcel Tschudin
and others for their help and constructive feedback. Any remaining
errors in methodology or results are my responsibility of
course!!! If you want to provide constructive feedback, let me know.
Disclaimer and Copyright
 Home
Home Up
Up Search
 Mail
Mail
Major content related changes: August 10, 2017


