NEW
- Low height range of CASES99Bench (blue dots)
A logarithmic of quadratic curve (depending which has the maximum goodness of fit [R2/coefficient of determination closest to 1]).
- High height range of CASES99Bench (orange dots)
A linear curve (showing a lapse rate).
The CASES99 HT profiles look to have above the surface layer an average lapse rate (up to 58.1m) of 0.036K/m for Sunrises and 0.009K/m for Sunsets. This behavior is indeed expected due to the well developed NBL of the night.
- A surface layer point
The surface layer point between the two ranges (in below graph at 10m) was optimised to fit an overall smooth result (gray dots).
There is no significant difference in the height of the surface layer: 18m for Sunrises and 17m for Sunsets. One would expect a higher surface layer for Sunrise due to the well developed NBL of the night.
The eye is at 1.65m height (Near). All profiles are extended up
to 85km with MUSA76 profile (average temperature
gradient=0.0065K/m between 58.1m and Hr at -56.5C
[around 11km]).

The eye is at 58.1m (Near) and the vast level surface is at 10m
(Distant). If using a vast level surface at
1.65m, the CASES99 profiles give refractions that make the ground
go high up around
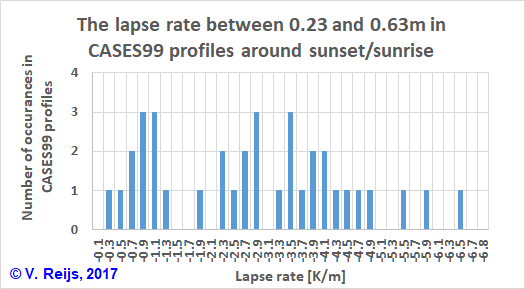
zero (AZAAR) and negative (NAAR) apparent altitudes. because the near ground lapse rate (between 0.23
and 0.63m) is lower than -0.11K/m (see below picture). So a
Fata Morgana (superior mirage) is what happens.

To get enough data to compare, the vast level surface has been
put on 10m and some profile change was made to MUSA76:
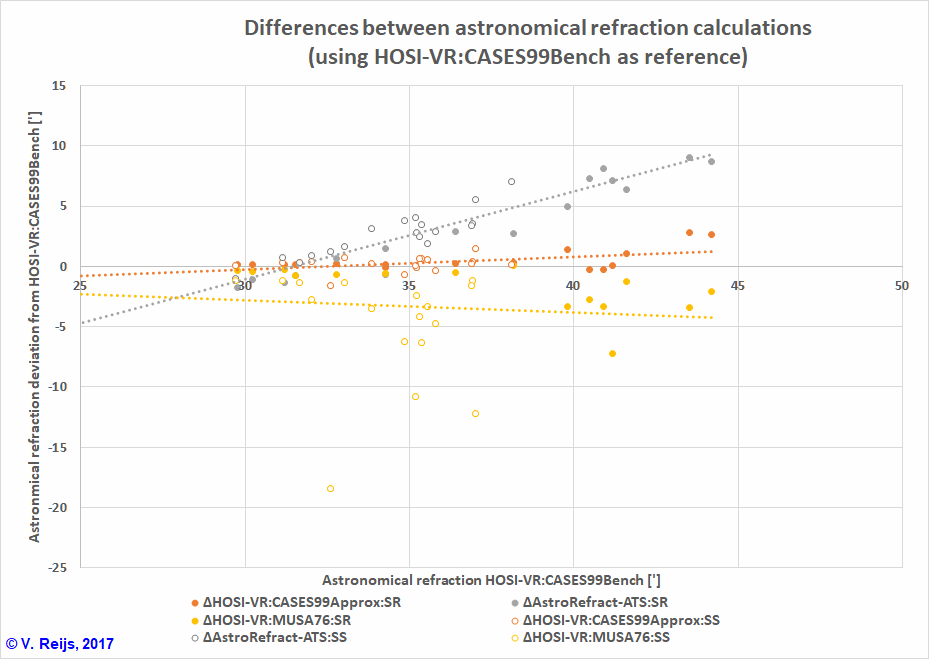
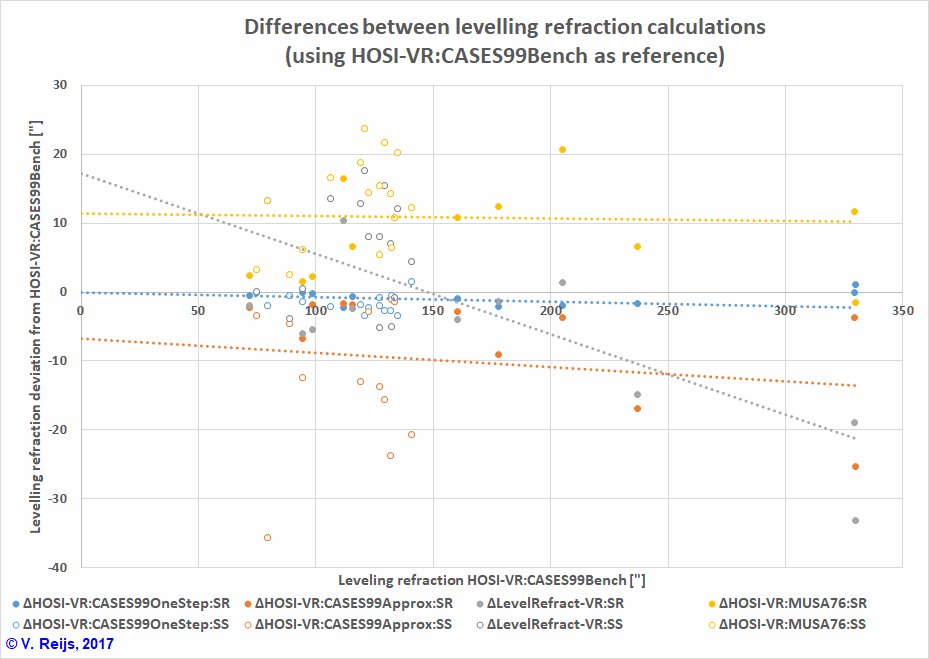
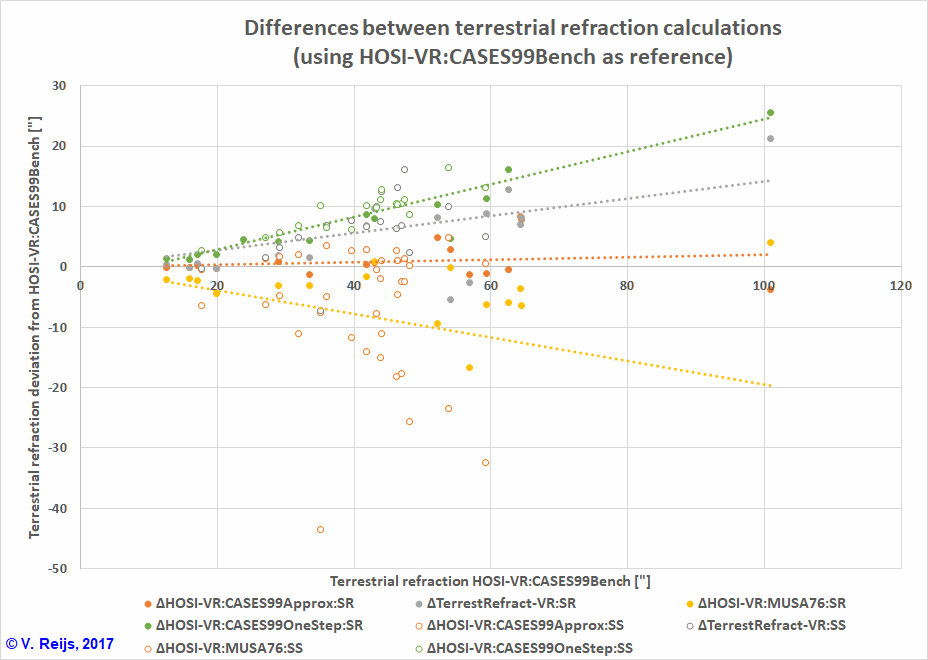
Below one can see the differences (in arcsec) with the reference data (CASES99Bench):


If we check the differences from the CASES99Bench
results, we get the following overview (between bracket the
average value):
| Refraction
difference [% from CASES99Bench refraction] |
|||
| Astronomical |
Levelling |
Terrestrial |
|
| CASES99Approx | 2 |
10 |
0-15
(7.5) |
| CASES99OneStep |
Not valid |
2 |
0-70 (35) |
| MUSA76 | 10 |
10 |
0-80
(40) |
| Formula |
0-15 (8) |
0-15 (8) |
0-50 (25) |
| Maximum of above |
10 |
10 |
40 |
| Approximate
absolute values |
|||
| AppAlt of CASES99Bench ['] |
9' |
-11' |
60' |
| Refraction of CASES99Bench ['] |
30'-45' (40') |
70"-330" (4') |
15"-100" (1') |
<Green means the best
mapping profile>
<Red means the on average
worse mapping profile>
CASES99Approx is the best solution;
except for levelling refraction where it is CASES99OneStep. MUSA76
looks not to be the best method.
The Formula perform in an average way.
All of these methods (including CASES99Bench) have the drawback
that for former times (like in archaeoatronomy) the parameters
(like [approximated] HT profile, Near&Distant temperature or
average lapse rate) are unknown and very difficult to predict.
So perhaps we need to try our best to predict the parameters (by
knowing the events [rise/set], the location, a general idea of the
HT profile and the temperatures), and this might give the accuracy
quoted in the above table in the row Maximum
of above for the different refractions. This is not
that far from the astronomical refraction variation seen in this web page. (around
5' variation of the astronomical refraction at AppAlt=9')