Refraction determination
Using a derivative of Hohenkerk&Sinclair's implementation
(1985) of Auer&Sandish (1979) refraction model, one can see
what the effect is of a changing temperature gradient near ground
level (Reijs, 2007). Several temperature gradient values are
typical for certain atmospheric conditions (Sun's insolation, wind
speed, cloud cover, cloud height and time of day) and these are
defined as stability class A to G. The temperature gradients
belonging to these stability classes range from <-19 (stability
class A) to >40 C/km (stability class G).
The variability due to ranging temperature gradients (as defined by for instance
stability classes) is given in this graph (Reijs, 2007):
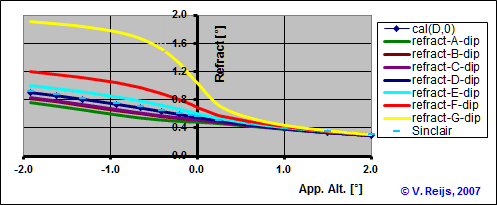
The apparent altitude in above picture is related to two
different horizon configurations:
- Positive apparent altitudes are for astronomical refraction
over a real/imaginative terrestrial marker (terrestrial
refraction).
- Negative apparent altitudes are for astronomical refraction
over a vast plane surface (aka terrestrial refraction; sometimes
called: levelling refraction)
Stability class G can happen
normally during midnight and Stability class A can happen during
noon. Depending on the atmospheric conditions the
temperature gradient around sunrise or sunset can be close to
these temperature gradients (aka stability classes). Sunrise conditions can be more
varying than the sunset temperature gradients (Lapworth
2003, 2006).
Dynamics of the temperature gradient and its influence on the
ray's curvature radius
The influence of the temperature gradient of on the radius of the
light ray's curvature can be seen in below picture:
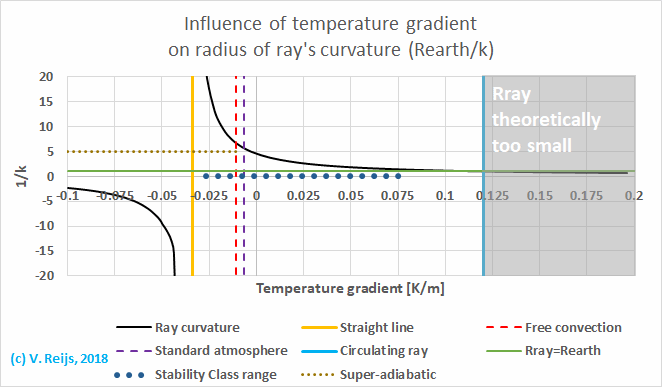
So the temperature gradient of lower than -0.043K/m results in rays
that get a negative radius, meaning that they will be refracted
upwards (in that case the celestial object will be seen lower in the
sky than 'normal'). If the temperature is larger than 0.12K/m the
light ray ends up on the ground (the realm of mirages).
An example of refraction due to a temperature inversion
The Sun can be disfigured due to the temperature profile and one
of such happens when there is an inversion in the
height-temperature profile causing a mock-mirage. See in below picture for the
profile:
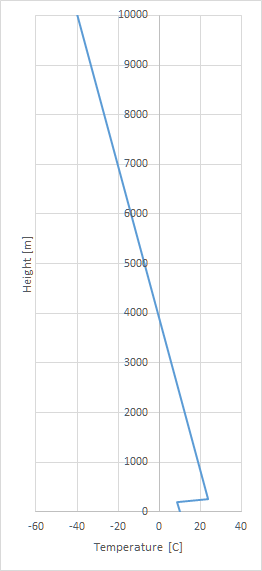
The refraction that happens with one's eyes at 350m height, can be
seen in below picture (using my implementation of
Auer&Standish):
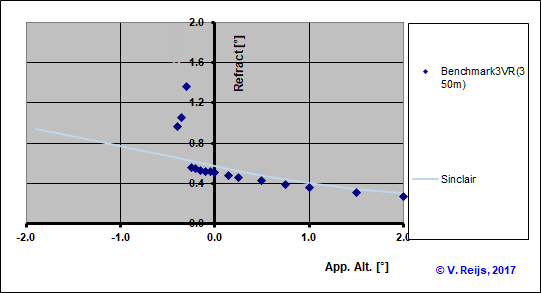
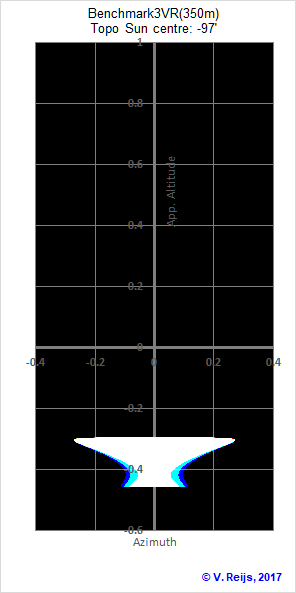
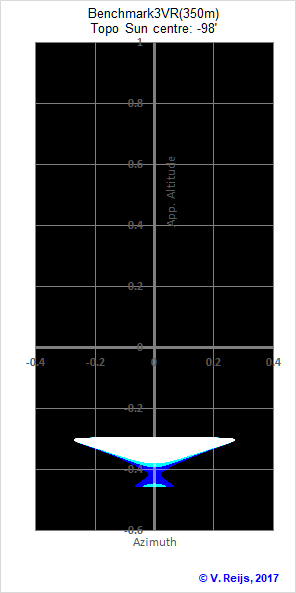
Using this refraction behavior, a ducted Sun can be seen in the
following few pictures, with the setting Sun is at different
topocentric altitudes (of course the Sun would be much more orange
when it is near/below the horizon):
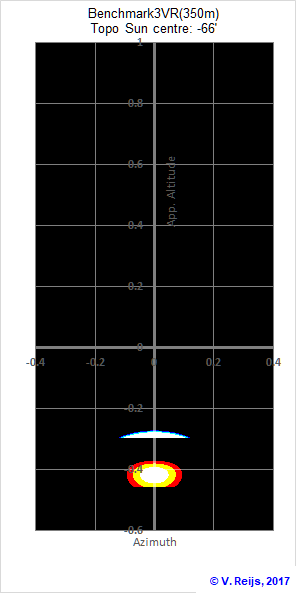
Sun at -66' in benchamerk3 (eye at 350m) |
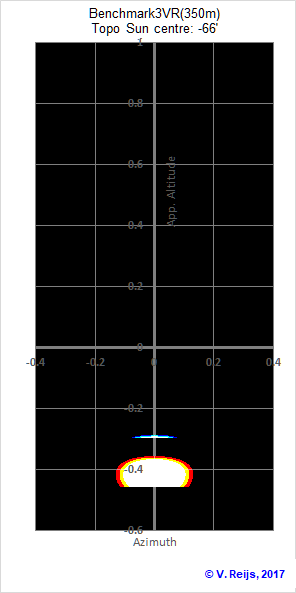
Sun at -67' in benchamerk3 (eye at 350m) |
|
Sun at -97' in benchamerk3 (eye at 350m)
|
Sun at -98' in benchamerk3 (eye at 350m) |
The blue flashes are seen difficultly in the rise/setting
environment, but green
flashes are witnessed. Red travels well in the horizon
environment and can be seen as red flashes.
An animation of this can be seen here. A
similar event has been witnessed in
real live.
Variation in profiles
If we average the refraction
seen due to varying temperature gradients (given by the 950 event
observations [three years] at the Pilgrim power
plant during consecutive days), we see the following graph
(the averages: single lines (axis in the middle); the standard
deviation: double lines (axis on the right side)).
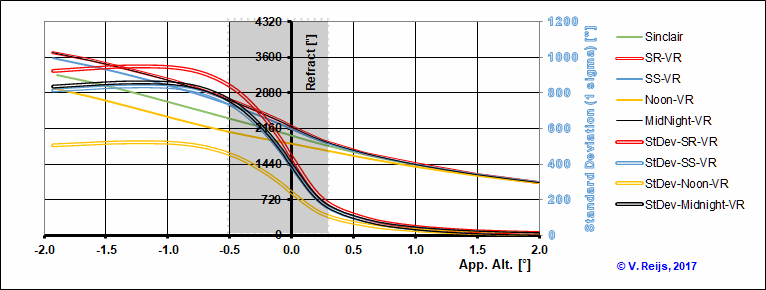
One could distinguish three apparent
altitude regions that are resulting due to variability of the
temperature gradient:
- Positive Apparent Altitude Refraction: PAAR
above AppAlt=0.25, the standard deviation (1 sigma), due to
variation of temperature gradient, is smaller than 6'
- Negative Apparent Altitude Refraction: NAAR
below AppAlt=-0.5, the standard deviation is larger than 30' and
slightly decreasing
- Around Zero Apparent Altitude Refraction: AZAAR
between the above two boundaries, the standard deviation changes
between 6' and 30'.
Refraction sensitivity due to
parameter changes
By varying the refraction model's parameters, one gets an idea of
the sensitivities due to these parameter changes. The following
parameters were changed (one parameter was changed while keeping the
others at their Default value):
Parameter
|
Latitude
[°]
|
Temperature
[°C]
|
Air
Pressure
[mbar]
|
Relative
Humidity
[%]
|
Wave length [nm]
|
Temp. Gradient [K/km]
|
Surface
layer height [m]*
|
Minimum
|
30 |
0 |
913.25 |
0 |
532 (green)
|
-26 (stability class A)
|
50
|
Default
|
47.5
|
15
|
1013.25
|
30
|
600 (orange)
|
-10 (stability class D) |
500
|
Maximum
|
65 |
30 |
1113.25 |
60 |
650 (red)
|
80 (stability class G) |
750
|
Resulting sensitivity
in refraction (around AppAlt=0)
|
0.05%
|
9%**
|
11%** |
0.3%
|
0.5%
|
11%(A) /
93%(G)
|
0.8%
|
* Surface layer does not really exists at
the Default value of Temp. Gradient.
** Similar sensitivity is seen when using the formula
A graphical representation can be seen here:
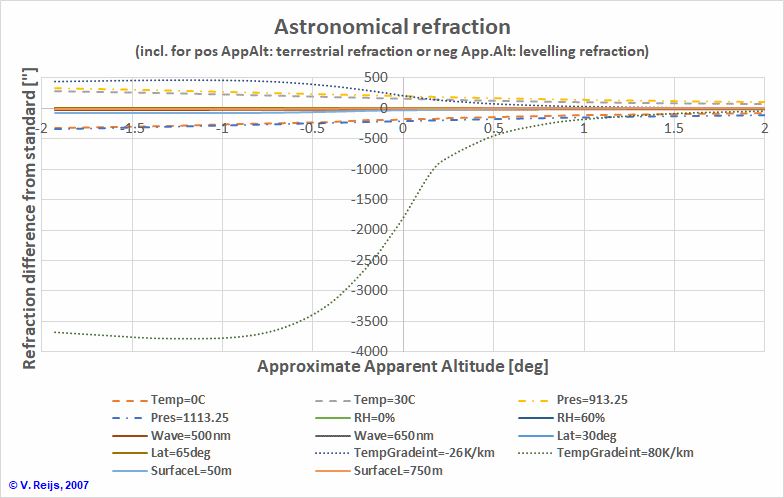
At Apparent altitudes lower than 1 deg: the Temperature Gradient
provides the largest sensitivity, followed by Air Pressure and
Temperature. The other parameters don't effect significantly the
refraction. At higher apparent altitudes the Air Pressure and
Temperature influences are the largest, while Temp. Gradient's
sensitivity diminishes.
The influence of the maximum height for the HT profile on the
astronomical refraction can be seen below. When using a cut
off height for the MUSA76 profile, the influence can be seen in the
below table and graph:
Cut off height
[km]
|
Reduction from astronomical
refraction
(reference: 85 km HT profile and AppAlt=0) [%]
|
.25
|
85%
|
.5
|
80%
|
1
|
70%
|
2.5
|
50%
|
4
|
40%
|
8
|
20%
|
11
|
13%
|
20
|
2.5%
|
32
|
0.3%
|
47
|
0.04%
|
51
|
0.03%
|
71
|
0.003%
|
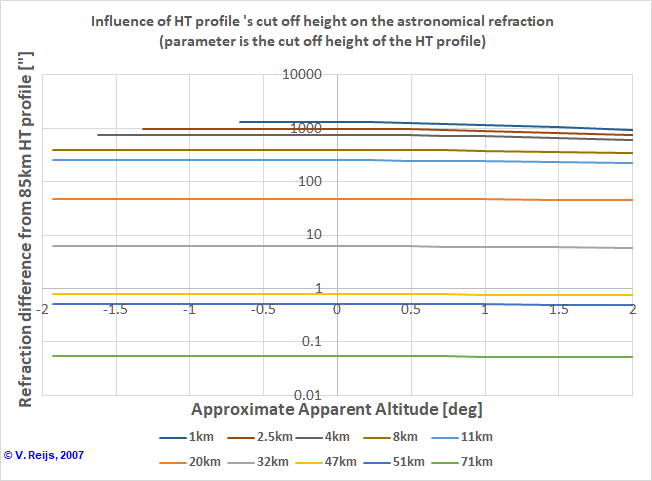
A cut off height of the HT profile for higher than 20km is essential
to be keep accuracy (within arcminutes) high enough. Reducing the HT
profile's cut-off height to 11km, has a smaller influence than the
variation due to Temp. Gradients (certainly below AppAlt=0, aka NAAR
region).
It is also clear that the first 2.5km of the ray's path determines
almost 50% (100%-50%) of the astronomical refraction.
Comparing VR's refraction implementation
(in PAAR region)
Beside the webmaster's Auer&Standish (1979) implementation
(VR); Marcel Tschudin
(MET) and Andrew Young (ATY) also have an implementation of
Auer&Standish, while Siebren van der Werf (SvdW) (2003,
2008) has his own methodology and implementation that allows
for non-spherical symmetry in the HT (Height-Temperature)
profiles (which can be very handy when have more complex
landscapes, as described
here). The three implementations have been benchmarked
and they provide within arcsecs the same results.
The HT profiles were provided by Steve McCluskey (SMcC), who
derived them from the CASES99 study. Four HT-profiles (being
outliners during CASES99 sun rise events) were used for
comparing the three different implementations. The results
from the four HT profiles within these three implementation
can be seen in below graph:
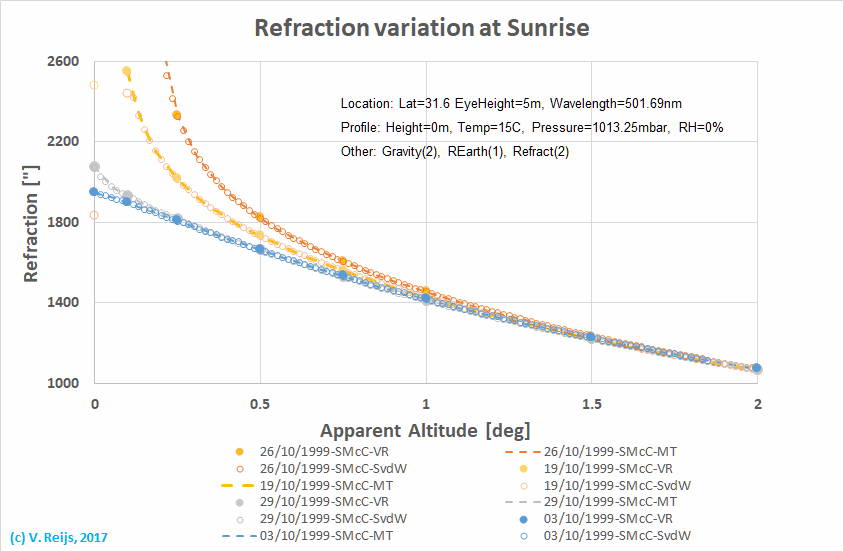
The four implementation
provide similar outputs for these four events, this shows
that the results of the implementations and methodologies
are reproducible. Such similarity happens both for ground
elevations of 0m (NAAR, AZAAR and PAAR) and 433m (PAAR), so
the four implementation are also handling the elevation of
the ground properly.
For around zero and
negative altitudes (AZAAR and NAAR) the HT profile can cause
problems (ducting) in the Auer&Standish implementations;
van der Werf's method is able to overcome this problem by
changing the HT profile depending on the distance from the
observer (aka allowing non-spherical symmetry). But several
benchmark tests have been performed with a HT profiles that
produce ducting and the four implementations provide within
arcsec agreement.
Comparing
refraction variation
The following
evaluation was made by looking at the refraction variation in the
PAAR region (all have a different way of statistical evaluation):
- VR based it on Pilgrim power plant data collected during 950
days of 2001-2003
Location: Plymouth, Massachusetts.
Climate zone: Dfa.
Weather
considered: all weather conditions
Start of HTPR profile: 0m,
15C, 1013.25mbar and 0%,
observer at 5m: LABL
Time of observation: 0.5 hour period before/after SS or SR.
Standard deviation derivation: 1 sigma in
refraction at the SS/SR event; determined by using
the distribution of
temperature gradients (based on Stability
classes).
Refraction
determination: MUSA76
and
Auer&Standish
- MT based it on averaged balloon soundings (6 seasons)
Location: Coastal regions.
Climate zone: C.
Weather considered: removed all events if station pressure was
lower than the lower 1 sigma limit.
Start
of HTPR profile: 0m,
15C, 1013.25mbar and 0%,
observer at ???m: LABL?
Time: 1 hour period before/after SS or SR.
Standard
deviation derivation: Twice 1.5MAD (could be
equivalent to 1 sigma) in HT profiles at
the SS/SR event.
Refraction
determination: balloon soundings and
Auer&Standish
- CASES99 based on Stephen McCluskey's
derived HT profiles from the CASES99 study
on 18 dates (one month: October 1999):
Location: Leon, Kansas. Location
of the CASES99 project is described here. The location is not
precisely known (yet), but this one is used for the HeyWhatsThat
skyline.
Climate zone: Dfa.
Weather considered: clear, around Sun set/rise
strong inversions (Fata Morganas)
Start
of HTPR profile: 0m,
15C, 1013.25mbar and 0%,
observer at 5m: LABL
Time: 5 minute period before/after SS or SR.
Standard
deviation derivation: 1 sigma in the refraction at
the SS/SR event.
Refraction
determination: MUSA76
and
Auer&Standish
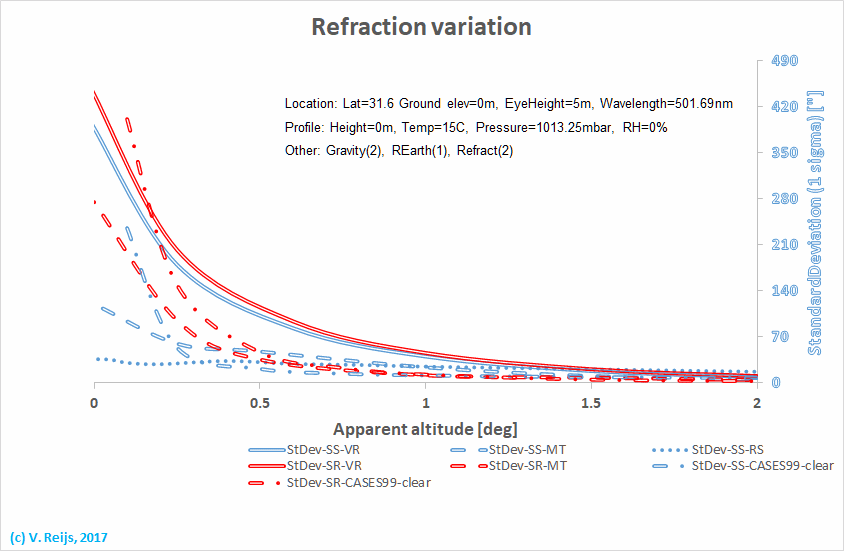
As the statistical and atmospheric conditions of the above sets are
quiet different, more study needs to be done, to be able to compare
like with like.
Refraction measurements
The following refraction measurements have been gathered: looking at
the refraction variation in the PAAR, AZAAR and NAAR regions (all
have a different atmospheric conditions):
- RS
based on photometric measurements of Sunsets on 14 days
(Sampson, 2008)
Location: Barbados, West Indies
Climate zone: Af
Start
of HTPR profile: 0m,
station TPR (unknown), observer at 2.5m: CABL
Weather conditions: clear
Time: before sunset (Sun's upper rim for 2 to 0 deg)
Standard
deviation derivation: 1 sigma in the refraction at
the SS/SR event.
Refraction
determination: observations
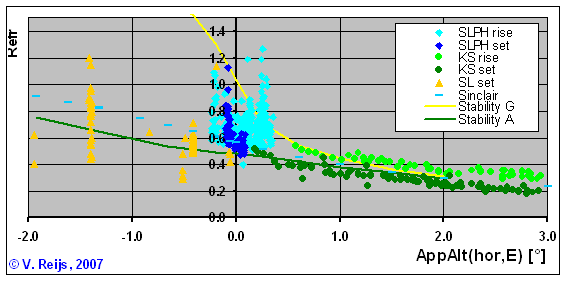
- Other
measurements in PAAR, AZAAR and NAAR
regions can be seen in this link. And here is
that graph repeated and compared to calculations using:
Sinclair (using USA76 model) and Stability classes A and G
(using MUSA76 model). All the measurements are based on their
own station heights, and station TPR and all involved a vast
plane surface (levelling refraction).
References
Auer, L.H., and E.M. Standish. 1979. Astronomical refraction:
Computational method for all zenith angles. (Yale University
Astronomy Department note).
Hohenkerk, Catherine Y., and A.T. Sinclair. 1985. "The computation
of angular atmospheric refraction at large zenith angles." ed. by HM
nautical almanac office. Cambridge.
Lapworth, Alan J. 2003. 'Factors determining the decrease in surface
windspeed following the evening transition', Quart. J. Royal
Meteorological Society, Vol 129: pp. 1945-68.
Lapworth, Alan J. 2006. 'The morning transition of the nocturnal
boundary layer', Boundary-Layer Meteorology, Vol 119: pp. 501-26.
Reijs, Victor M.M. 2007.'Refraction: Refraction calculation', in
http://www.archaeocosmology.org/eng/refract.htm#Calculated [accessed
2 July 2012].
Reijs, Victor M.M., 2017, "Geniet: Thom's terrestrial refraction
observations", http://www.archaeocosmology.org/eng/Thom-refraction.htm
Sampson, Russell D., Edward P. Lozowski, and Arsha Fathi-Nejad.
2008. 'Variability in low altitude astronomical refraction as a
function of altitude', Applied optics, Vol 47: pp. H1-H4.
Thom, Alexander. 1958. 'An empirical investigation of atmospheric
refraction', Empire Survey Review, Vol 14: pp. 248-62.
Thom, Alexander. 1971. Megalithic lunar observatories (Oxford
University Press).
Werf, Siebren Y. van der, Gunther P. Konnen, and Waldermar H. Lehn.
2003. 'Novaya Zemlya effect and sunsets', Applied optics, Vol 42:
pp. 367-78.
Werf, Siebren Y. van der. 2008. 'Comment on “Improved ray tracing
air mass numbers model”', Applied optics, Vol 47: pp. 153-56.
Acknowledgements
I would like to thank people, such as Thomas
Cough, Stephen
McCluskey, Marcel Tschudin, Siebren van der Werf,
Andy Young and others for their help and constructive feedback.
Any remaining errors in methodology or results are my
responsibility of course!!! If you want to provide constructive
feedback, let me know.
Disclaimer and Copyright
 Home
Home Up
Up Search
 Mail
Mail
Major content related changes: October 5, 2017


