Using two temperature sensors at one location
Using two temperature sensors at one
location by Victor Reijs
is licensed under CC
BY-NC-SA 4.0


Introduction
The aim is to meaure temperatures at different heights and see how
this links with low pressure regions and
rain (that work was done to detemrine the influence of
temperature gradient on the refraction of light rays through the
atmosphere: as part of my archaeoastronomy work).
Two Boxes (one at 1m heigh and another at 4.8m height) are checked
with regard to temperature differences (at location Lemelerveld, The
Netherlands). Logging of data happes by using the SlimmeMolen
infrastructure.
Temperature and air pressure sensors have been calibrated. The
temperature sensors were compared with a thermo couple. The air
pressure was compared with weather station nearby (10km). Using a
weather station much further away does not compare well; I used
initially a meteorolgical station some 90 km away and that was not
provding the correct calibration values for my region (size of low
pressure region becomes problematic).
Make sure there is no (in)direct Sunlight on the sensor or into the
space of the sensor.
It is planned to have two thermo couples (although the themrocouple
sensor accuracy migth not be good enough) will be positioned at De
Zwiepse Molen: one at dust floor (some 10m hight); one at gallery
level (some 5.5m high); and the ESP32 is connect to the Internet
from the ground floor. Logging of data will happen by using the SlimmeMolen
infrastructure.
Testing of thermocouple sensor gave the following findings:
- The accurcy of K-type thermocouple is around 2.2C. So a
large inaccuracy, \\.
- The resolution of two tested thermocouple sensors (MAX6675 and
MAX31855K) was 0.25C, so not really accurate enough for
determing a temperature gradient.
Definitions of abbreviations
Measuring temperatures at different
heights
Several findings have been found (live the measurements can be seen here):
- Experiences due to influence of solar radiation (the top
curves are temperature, the bottom curves are air pressure):
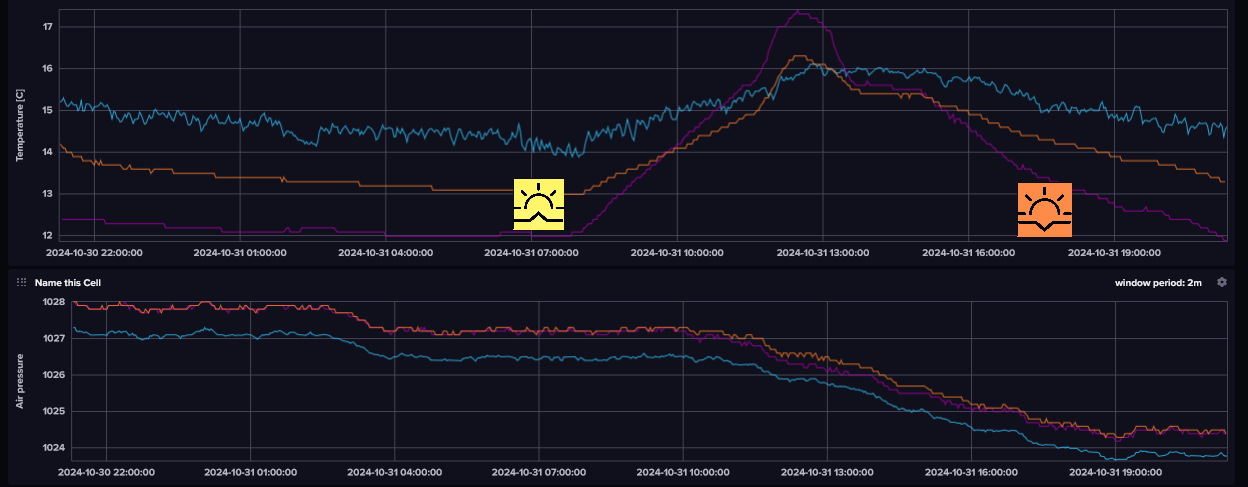
Blue line: is at the front in an open balcony (the balcony
is inside the house: M5/B1). The senor is at ~4.8m from
ground level
Purple line: is at the back beside a shed in the open
(against the shed wall: M3/B2). The senor is at ~1m from
ground level.
Orange line: is at the front in an open capony at the garage
(M3/B3). The sensor is at ~1m from ground level.
- The air pressure (at the heigth it is measured) for the
location higher up (blue) is lower (purple and orange)
around 1.5mbar/3.8m. The general increase is expected as
there is less air on top. In general 1mbar change per
8m, so we measure a little higher: around 3mbar/8m.
- During the night; the temperature at higher location
(blue) is in many instances higher (negative temperature
gradient: night inversion)
- During the day: the temperature at lower location
(purple and orange) is in many instances higher, due to
Sun's activity say an hour after Sun rise (positive
temperature gradient) and an hour before Sunset. Ths
effect is depending
of cloud cover.
- The peak of the temperature is a little later for the
high location than for the low location. This is expected
as the ground temperature will increased faster than the
air temperature [Watts, 2007, figure 8.1].
- Exposure of temperature sensors to Sun influences the values
considerable. Good protection is essential. The purple sensors
(M3/B2) is in the shade always.
- One sensor (M3/B2) stands against a PVC North facing wall
and opposite a pond. It is not expected that this pond will
have influence on the measurements.
- The influence of a low pressure region (being on a conave
isobar around a low pressure ragion) and its fronts
- Looking at temperatures
(blue: at 4.8m height and purple: at 1m height) and air
pressure (again, as expected the air pressure at 1m height
is a little higher than at 4.8m) during the passage of two
deep low pressure regions (Bert and Conall). The weather
maps are from KNMI.
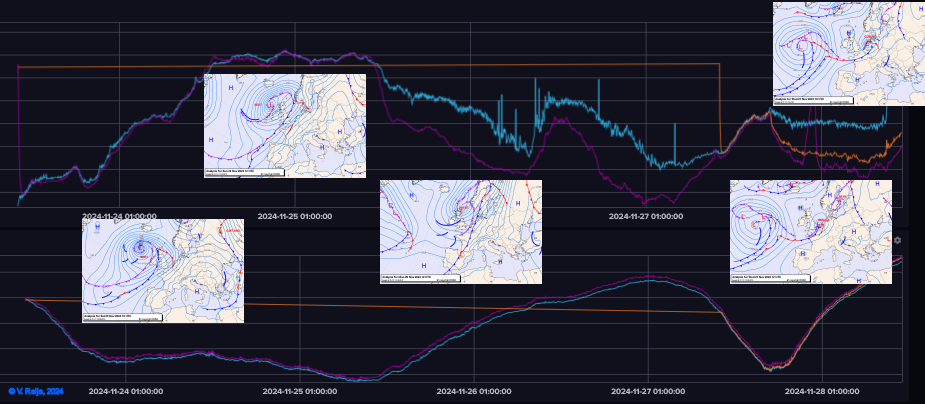
- When going through a warm front to a warm sector; around
18:00 23-11-2024, the temperatures rise and air pressure
is constant.
- Between 10:00 and 16:00 24-11-2024, the low height
temperature is higher than the high height temperature
(positive temperature gradient during the day).
- When being in the warm sector (or perhaps the
convergence line, although that is more to the south);
around 12:00 24-11-2024, the temperatures stay constant
and air pressure is constant.
- When going through a cold front; around 12:00
25-11-2024, the temperature at the low height drops with
regard to the temeprature at the high height, and both
drop and air pressure rises.
- The air pressure behavior in period between bullets 1 en
4, can also be seen in literature [Karnetzki, 2001, page
45]. WF=Warm front; KF=Cold front.
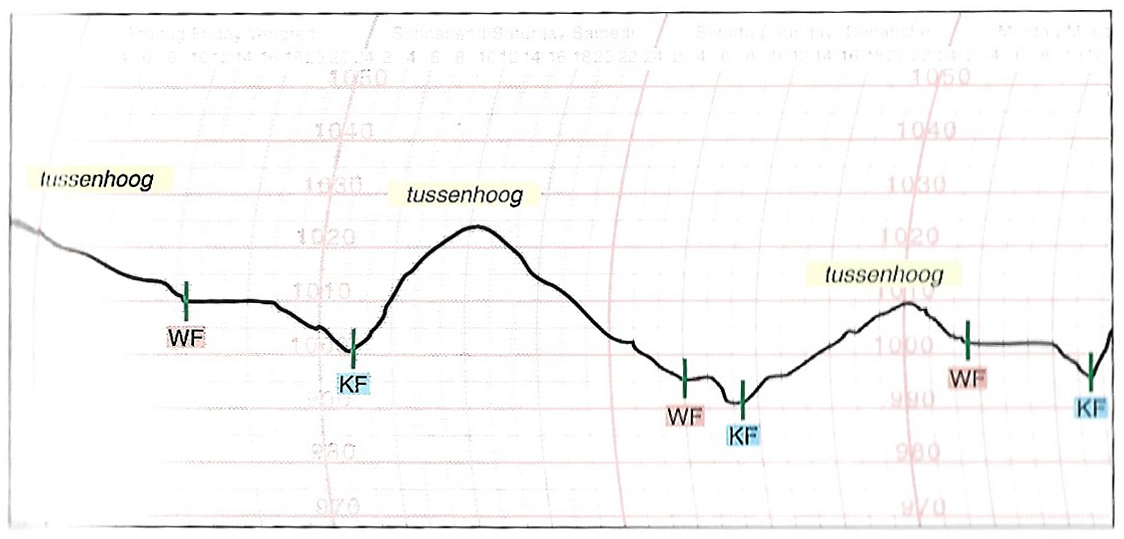
This type of air pressure behavior can indicate the
miller for an upcoming or present low pressure region.
So not really a warning!
- When going through a warm front to a warm sector; around
12:00 27-11-2024, the temperatures rise and air pressure
drops.
- When going through a cold front; around 18:00
27-11-2024, the temperature at the low height drops with
regard to the temeprature at the high height, and both
drop and air pressure rises.
- Looking at
temperatures (blue: at 4.8m height and purple: at 1m height)
and air pressure (again, as expected the air pressure at 1m
height is a little higher than at 4.8m) from 29-11-2024
until 5-12-2024. The weather maps are from KNMI.
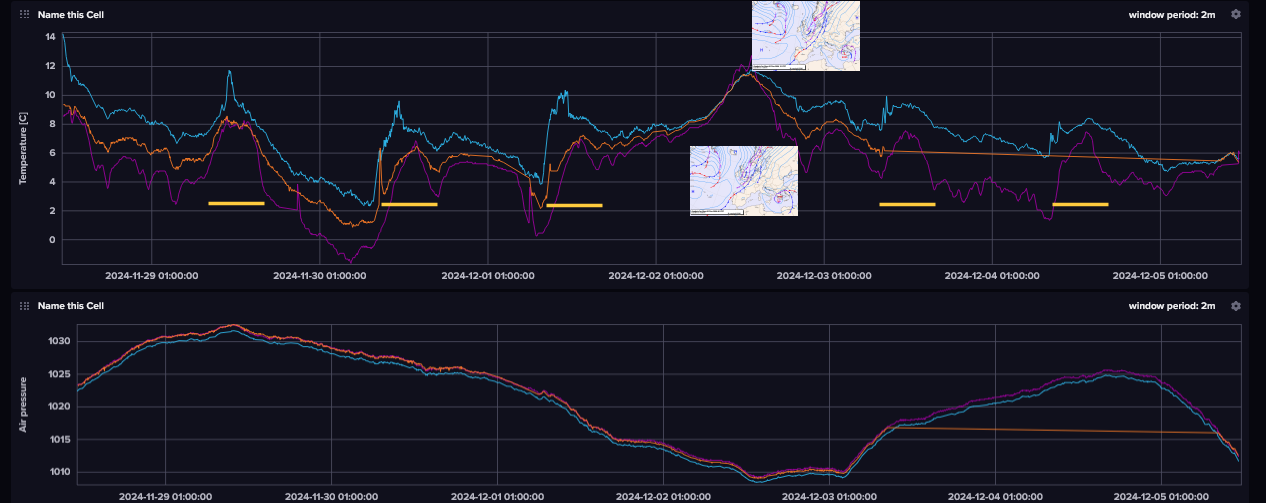
- One can see the day-to-day weather due to the solar
radiation (yellow lines which are more or less centered
around midday).
- Around 07:00 2-12-2024 the high and low location
temperatures become similar (through a cold front: part of
a stationary front?) and the temperatures diverse again
after an occlusion (around 14:00 2-12-2024).
- It looks that if high and low temperatue are similar
(during the night) a low pressure region is coming/passing
(remember ths does not have to be a low pressue value).
So this is an indicator for the miller that a low
pressure region is coming.
- There a relation between low and high level temperatues
with low and high pressure regions. The temperature gradient
looks to become smaller in a low presssure regime (see the
blue circled area)
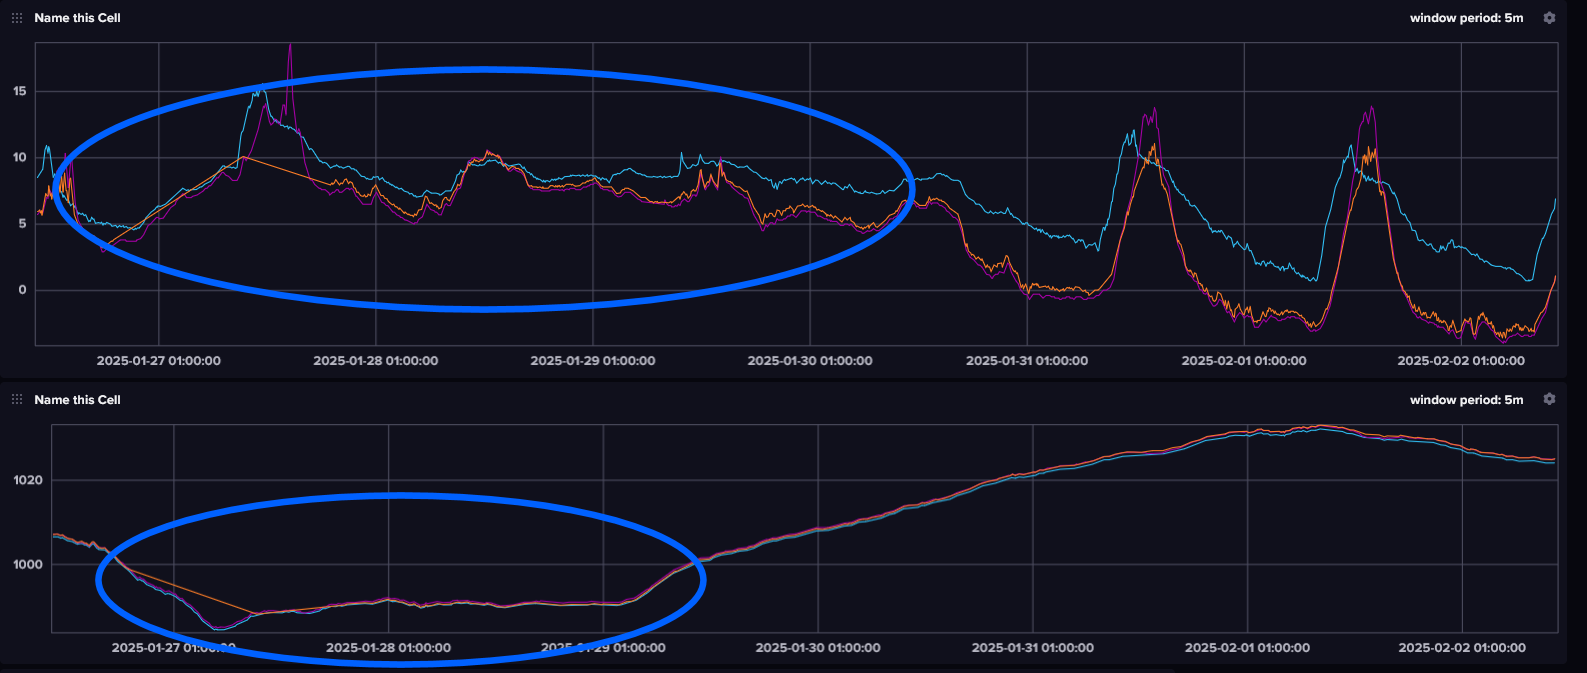
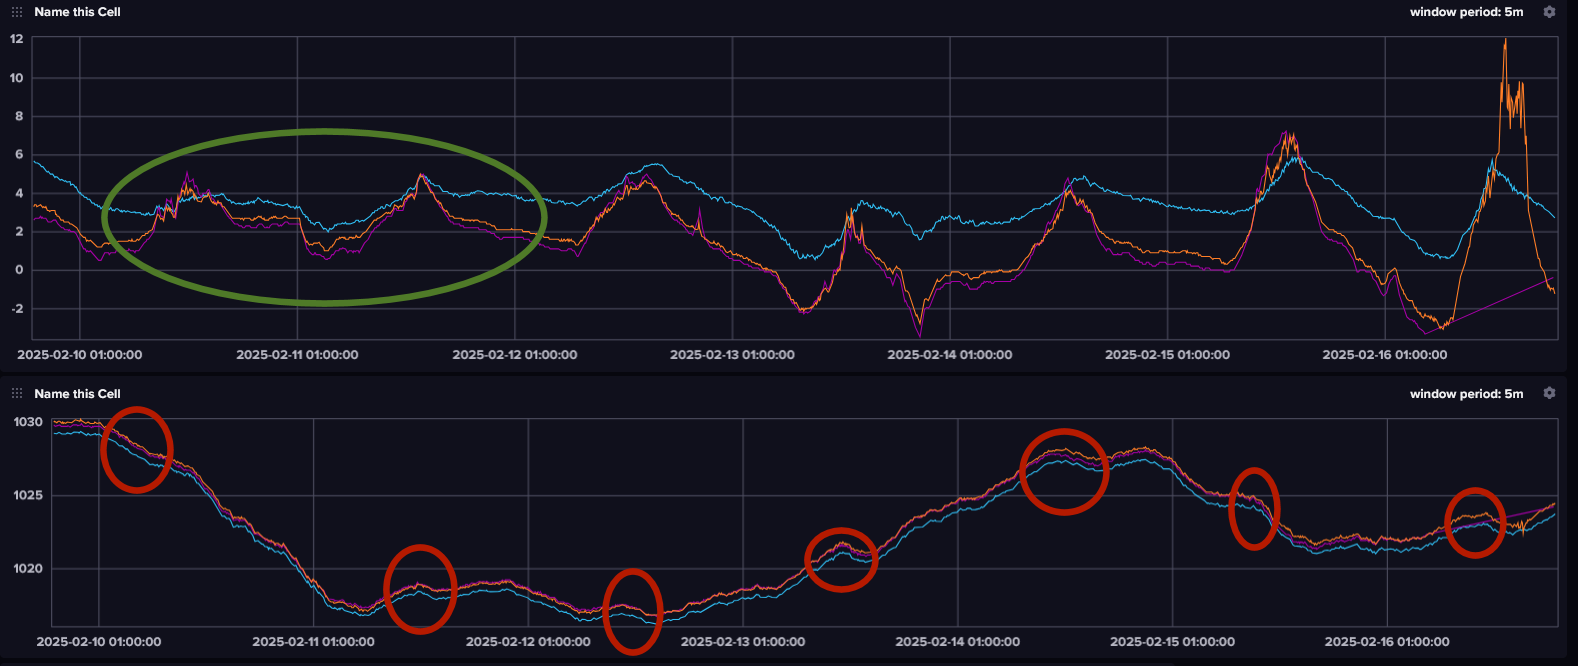
or towards a lower pressure region (see below green circled
area):
High pressure regions can raise the tropopause slightly, as
subsiding air compresses the atmospheric layers and warms
the troposphere.
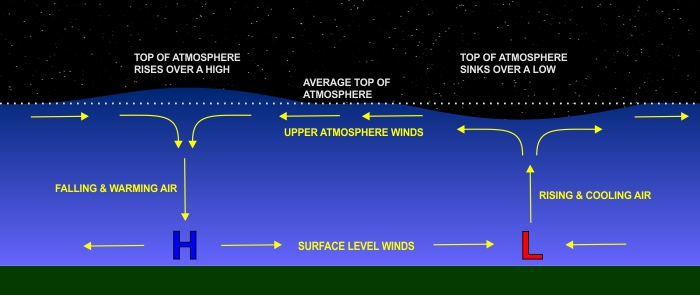
Furthermore regions with a higher tropopause (like the
tropics and high pressure areas) have a stronger temperature
gradient [missing a proper reference: got this through
Microsoft Copilot!]
- Information gotten from a met-person (pers. comm., Anom,
2025), concerning a larger temeprature gradient during the
night:
- there are less clouds during the night
- the ground is drier due to day's Sun
- there is less wind
- the relative humidity is on average lower during high
pressure then during low pressure
- A high pressure area will normally have an inversion
(high up [1 to 3km] and then lowering [could be down to
ground level])
- When the Sun is above the horizon, the air pressure looks
to be influenced: first a very small rise around 10:00 and
than a larger lowering around 13:00: see above for the red
circled areas.
This could happen because a sensor's air pressure
measurement depends a little on temperature. The BME280 datasheet
gives a temperature coefficient TCOP of
~0.015mbar/°C.
Three things:
- The air pressure rise/set is independent of the location
of the sensor, so both the low and high level sensors have
this behavior.
- The temperatue increase could map the slight increase of
air pressure, but the end of the air pressure decrease
looks to happen around the peak in temperature (around
14:00) and not later if there would a direct relation
between air pressure and temperature.
- The air pressure decrease is around 0.2mbar while the
temperature increase is around 1°C
(but can be more, in above graph up to 3°C, on 16 Febr due to Sun ligth
through tree leaves).
So the air pressure decrease looks to be a factor 10
larger than expected due to the temperature coefficient
TCOP.
So is there an atmospheric reason
for this air pressure behavior?
- Passing of high trough
This gives three short cold spells, with rain and hail.
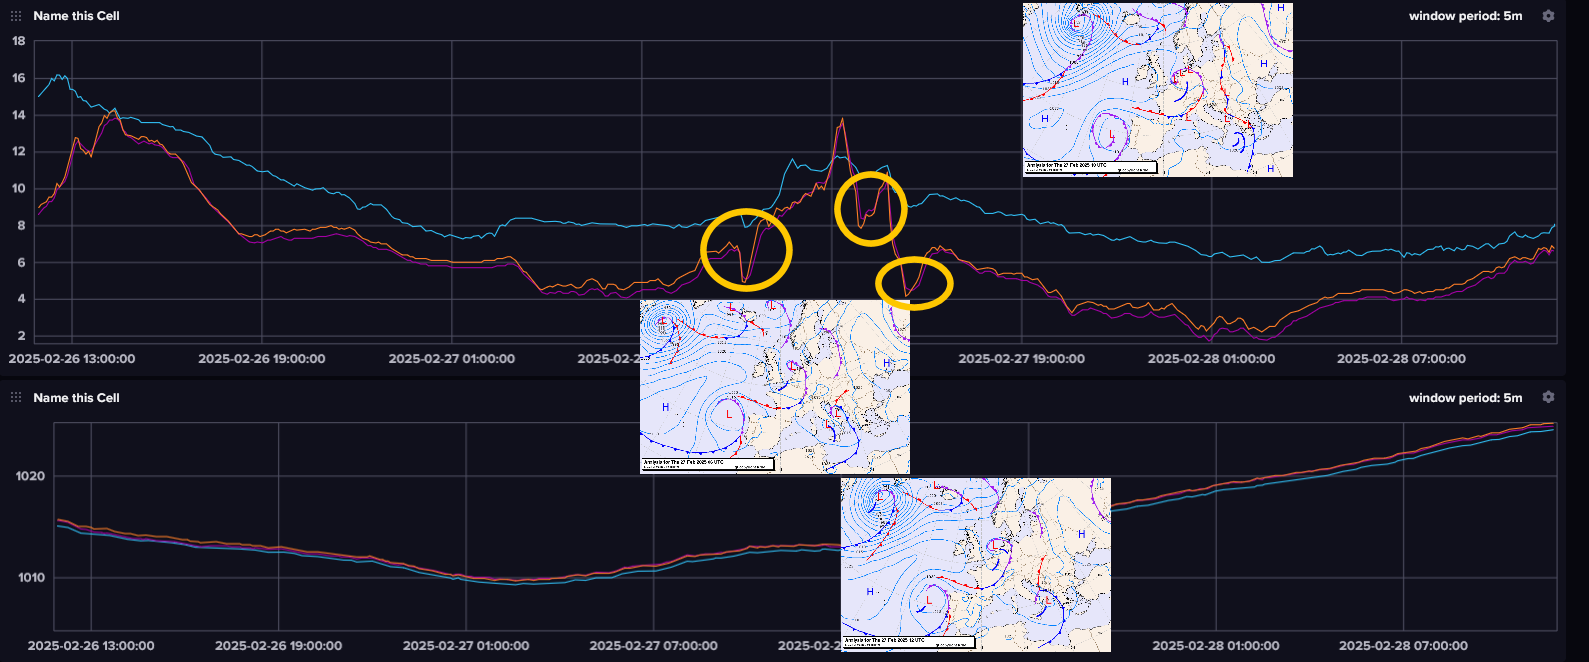
So dips in temperature can indicate to the miller that a
high trough is present (so is not really a warning, as it
is quite imenent and thus not an ahead warning).
- asdfsafs
Why monitor temperature and air pressure sensors
The following aspects can be derived when having two temperature
sensors (high and low) and one air pressure sensor (more air
pressure sensors are not needed):
- Sun rise/set (see here):
The temperature strats to rise more or less one hour after Sun
rise
The temperature strats to set more or less one hour before Sun
set
- The temperature gradient (lapse rate):
 = -(Thigh-Tlow)/(Hhigh-Hlow)
[K/1km]
= -(Thigh-Tlow)/(Hhigh-Hlow)
[K/1km]
The average Lapse rate (measured between 0, and 11km using ISA) is
6.5K/1km.
- Freezing point can help around slippery surfaces.
- Terminology of air pressure change:
Falling (or rising) slowly: 0.1 - 1.5mb/3hours
Falling (or rising): 1.6 - 3.5mb/3hours
Falling (or rising) quickly: 3.6 - 6.0mb/3hours
Falling (or rising) very rapidly: More than 6.0mb/3hours
- Wind velocity depending on rise/fall of air pressure:
- At sea:
1mb/hour: likely 6Bft
2mb/hour: likely 7 - 8Bft
3mb/hour: likely exceeding Force 8Bft
- At land:
1 or 2 Bft lower
- This change in air pressure can indicate to the miller
that severe wind is possibly coming.
- Remember that the wind can still be high regardless of
the air pressure change at one loation.
The air pressure change can have a zero rise/fall at
location (like in a warm sector), while a high wind can be
present due to a high density of isobars in the warmsector.
- Understanding of the behavior of low pressure region and the
wam and cold fronts on temperatures and air pressure.
Conslusions
- Air pressure at different height is behaving as expected: the
height has influence due to the air column being different.
- If the measurmene tocation is io the concave isobar aroudn a H
(or L), thsi looks to have influenc ei=on the temeprature
gradeint. Conave isobar around a high pressure ragion looks to
have a higher tempertatue gradient.
- More conclusions will be added when made;-)
References
Karnetzki, Dieter, Het weer van morgen: weerboek voor watersporters,
Hollandia, 2001.
Watts, Alan: Instant weather forecasting. London, Adlard Coles
nautical 2007.
Acknowledgements
I would like to thank people, such as David
Henneveld and others for their help, encouragement and/or
constructive feedback. Any remaining errors in methodology or
results are my responsibility of course!!! If you want to
provide constructive feedback, please let me know.
Major content related
changes: November 21, 2024