SlimmeMolen specs for traditional wind mills
SlimmeMolen specs for traditional wind
mills by Victor Reijs
is licensed under CC
BY-NC-SA 4.0


Introduction
This gives an overview of what sensors for this mill project
(Internet of Things molen -> SlimmeMolen) are needed and what
the connectivity (power, Internet, cloud) is expected.
A project
of using CFD (Computational Fluid Dynamics) is running since
Janaury 2023 to determine the windmill biotope.
The project aims are:
- Determine which parameters (and thus sensors) are important to
determine/predict windmill biotope evaluation
- Prototype the
SmartMolen ideas
- Get experience with CFD for determining the windmill biotope
- Validate CFD with actual measurements at a few windmills
- Evaluate CFD and other windmill biotope rules (DHM-formula [De
Hollandsche Molen] and Stephen Temple Molenbiotope spreadsheet)
and possibly propose possible improvements.
- Which CFD services can be used
looking at pricing, user-friendliness, experience, etc.
- Provide a how-to-guide, workflow and training around windmill
biotope for windmillers
- Publish the findings in mill-related publications and
interested organisations
This web page looks mainly at bullet 1.Experience with a prototype
of SmartMolen is available
here.
Bullets 3 and 4 are covered in several separate pages for: Den Oord,
Zwiepse Molen
and Impington.
As part of the Impington and SlimmeMolen research, bullet 5 will
be incorporated (DHM-formula
and Steven
Temple Molenbiotope-spreadsheet).
Bullets 6, 7 and 8 will be picked up as soon as more confidence
has been gained with CFD and measurements (aka the earlier
bullets).
A project has started (since Oct. 2024) by DHM to verify CFD with
wind measurements at a Dutch mill (bullets 3, 4, 5, 6, 7 and 8).
Why measuring around a mill?
There are a few areas why one wants to measuring things around a
traditional wind mill:
- Education/tourism/management
- Security/maintenance
- Productivity
- Short term local weather prediction
- Mill biotope
Each of them has measurements that can support that area and will
provide for a reference database of how wind mills perform and
will allow the verification of modelling the mill's biotope.
Luckily these areas have some common measurements:
Measurements
|
Areas
|
|
Projects
|
Education
|
Security
/
Maintenance
|
Productivity
|
Short
term
local weather
prediction
|
Mill
biotope
|
Spinning mills
|
eMill
|
smartmolen
|
SlimmeMolen
|
Revolutions per minute
|
x
|
x
|
x
|
|
x
|
|
x
|
|
x
|
x**
|
Number of turns per day
and/or year
|
x
|
|
x
|
|
|
|
x
|
x
|
x
|
x
|
Miller presence
|
x
|
x
|
|
|
|
|
|
|
|
x
|
Rotational speed at tip
|
|
x
|
|
|
|
|
|
|
|
x
|
Material stress
|
|
x
|
|
|
|
|
|
|
|
x*****
|
Brake is
released
|
x
|
x
|
x
|
|
|
|
|
|
x
|
x**
|
Mill can produce product
|
|
x
|
x
|
|
|
|
|
|
|
x
|
Storm/showers/lighting
|
|
x
|
|
x
|
|
|
|
|
|
x
|
Reference meteorological
station(s)
|
|
|
|
x
|
x
|
|
|
|
x
|
x****
|
Weather maps
|
x
|
x
|
|
x
|
|
|
|
|
|
x**
|
| Absolute wind
speed/direction at mill*** |
|
x
|
x
|
x
|
x
|
|
|
|
x*** |
x**,
***, **** |
Mill cap direction
|
|
x
|
x
|
|
x
|
|
|
|
x*, ***
|
x**, ***
|
Sail type
|
|
|
x
|
|
|
|
|
|
|
|
Turbulence Intensity
|
|
x
|
x
|
|
x
|
|
|
|
|
x**
|
Temperature
|
|
|
|
x
|
|
|
|
x
|
x
|
x
|
Air pressure
|
|
|
|
x
|
|
|
|
x
|
|
x
|
Humidity
|
|
|
|
x
|
|
|
|
x
|
|
x
|
Battery status
|
|
|
|
|
|
|
|
|
x |
x
|
Webcam
|
x
|
|
|
|
|
|
|
|
x
|
x
|
* The implementation
of cap direction (mostly based on magnetometer) needs to be
checked if it works for sporadic manual turning of (Dutch) wind
mills
** These are
measurements seen in 3 or more areas. So important to start with.
*** As the wind
direction equipment is positioned on the cap, the cap direction is
implicitly needed to determine the absolute wind direction.
**** If one wants to
verify wind speed en direction; the values at the mill need to be
compared with reference values at SYNOP/METAR/KLIM
meteorological station(s).
***** Sampling rate needs to be around 10 per
second (per 90deg rotation at least two samples [180end/min and
Nyquist criterium]).
In general all measurements and their results need to be
validated with theory and practice.
Sensors for the measurements
To perform these measurements, the following sensors are possible
(F: fixed; R: Rotating with mill cap or sails; E: Every sensor):
- Two (dry bulb) temperature
sensors (C) [F]
One at cap height and one at ground level (for instance using BME280, BMP280, BMP180, MAX6675 [thermocouple]), measuring the
outdoor temperatures. The temperature difference between the two
temperature sensors can be a warning for a
front. During a 2017 experiment
to determine the optical refraction, the temperature differences
was measured (height difference 2.8m and measurement interval
minimally 10min). This showed that the influence of rain and
fronts could be seen in the temperature differences. So this method
might perhaps be usable for windprediction at windmills.
Tested thermocouple sensors (MAX6675 and MAX31855K). Both have only a resolution of
0.25C, thus not very great.
Have not been able to get the one
type of MAX31855K working (too much interference???). Another
type of MAX31855K is working (althought using the default
CS [D6 on ESP8266] resets the ESP8266 at startup, so now using
D1 [and thus disabling a default I2C interface port).
- Air pressure sensor (mbar) [F]
This to determine the air pressure (for instance using BME280 or BMP180). This will provide an indication
for the going and froing of high or low pressure areas.
- Wet bulb temperature (C) [F]
This predicts the happening of dew on machinery and the human
comfort. Can be derived using BME280, by using humidity [%] and (dry bulb) temperature.
- Revolution sensor (ends/min) [R]
This sensor measures the rotations per minute of the wind
shaft/sails. This can be done with reflection surface, reed
switch or gyroscope sensor (such as MPU-6050) at vertical shaft. This data can
also be offered by/to the Spinning mills
and/or eMills projects.
One can determine what the minimum wind speed (energy) is
needed for the mill to rotate (when turning for de prins
or for production).
- Material stress (deg/sec and m/sec2) [R]
At the tip of the sail stresses can happen (in direction of
rotation, in direction of wind and torsie in the stock).
Measured using gyoscope and accelerometer (e.g MPU-6050) at tip of stock(s). To be used
for preventive maintenance.
The sampling rate needs to be high (sub second level).
Proper calibration of the accelerometer is important.
Use for instance Magneto.
- Mill cap direction (magnetometer, deg) [R]
This (can be QMC5883L
magnetometer) is to measure the direction of the mill cap.
Proper calibration of the magnetometer is important. Use for
instance Magneto.
- Wind direction (wind vane, deg) [R]
This can also be a magnetometer or an absolute angle detector (5
or 6bit; might be too expensive). A commercial weather station
is planned (such as: Ecowitt GW1103) to
determine local weather.
Alternative is using an analogue wind vane together with an ADC port on
ESP32/8266 (such as XDB1002-17 Series with mA output [into 100Ω ||
2.2µF]).
- Wind speed and gust (One to three anemometers, Bft, m/sec) [R]
This is to measure the wind speed. Two on each end of the long
stretcher and one on the mill cap. It needs to be determined
what is the best location for the anemometer at a
wind mill (with a tail). A commercial weather station is planned
(such as: Ecowitt GW1103) to
determine local weather.
Alternative is using an analogue anemometer (XDB1002-15 Series with mA output [into 100Ω ||
2.2µF] or this one which does not need power)
together with an ADC port on
ESP32/8266.
More than one anemometer is handy for determining the
best position of an anemometer at/on a mill.
- Gustfactor (vlaagfactor) and z0 (derived
from anemometer)
This can be derived from the variation in windspeed
(>5m/sec), using Benschop's vlaagfactor [2005a,
section 2.2; 2005b, page 877].
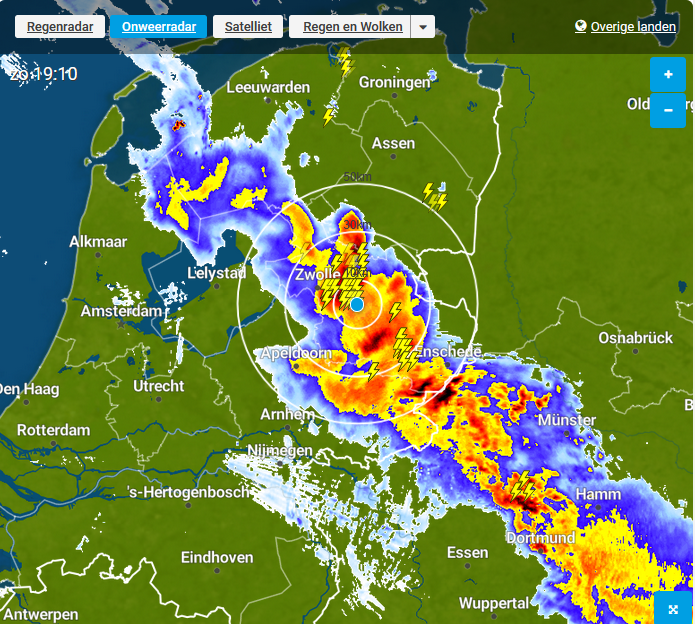
- Lighting detector (distance) [F]
Example of such a detector can be found here (AS3935) and also it can be an MF radio
(around 500kHz). Make sure your powersupply is a linear power
supply (and not a switching power supply [SMPS] as these give
too much noise)
I have the AS3935 (I2C) succesfully tested during a
thunderstorm on 20/7/2025 (using AS3935MI driver).
Here are the registrated lighting strokes on 20/7/2025, 21/7/2025 and 22/7/2025 (using
two AS3935):
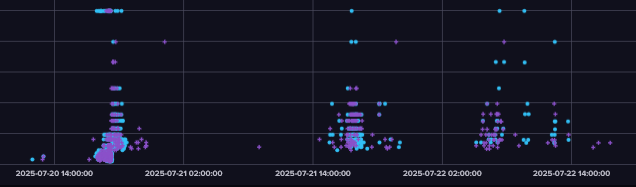
The high dots are strikes at overhead (1km) distances. while the
lowest dots are at 38km distance.
One can also use one's mobile phone (tested: iPhone SE [no
displayed screen]: the left top of phone between 0 and 3cm from
the AS3935; this generates many disturbers and some lighting
events [the reported km distance is somewhat depending on the
distance between phone and AS3935])
- Battery level (V) [E]
This to allow each sensor to signal if it has enough power, say
for the coming week (using ADC port of processor); if not it
should warn the outside world. Interpreting battery level might
not be very reliable though.
- Miller presence indicator [F]
This will show if a miller is present. Can be a reed switch at
the main door to the mill.
- Brake release indicator [R]
This will show if the mill can be producing (aka the mill is
allowed to turn). Can be a reed switch at the pawl or brake
beam.
- Webcam [F]
To show the mill from the outside. High speed Internet
connection is needed.
- Meteorological stations' wind speed and direction sensors (F)
To cross reference mill data, wind data of at least three
meteorological stations (KNMI acknowledged) needs to be
available through WebServices.
Processor at the sensor
Each (or a combination of) sensors will have a processor (such as
ESP32, ESP8266, Wemos, etc) and a WiFi connection. Preferable the
sleep mode of each sensor should be used (to reduce power
consumption).
Below remark can be handy
in case of reed switches:
The anemometer and rain sensors in my weather station 2 use
reed switches. To achieve low power, I had to use a second, low
power processor chip to monitor the reed switches while the
Wemos was in deep sleep.
Power for sensors
Some sensors (that are not in the mill cap, also reducing
lighting strikes) will be connected to the mains. The sensors in
the mill cap might be powered using: solar cells, wind turbine
and/or batteries or using reliable drag contacts.
Connectivity within the mill
Each sensor has a WiFi connection (and if possible all sensors
are meshed together in a WiFi mesh [like
ESP-Mesh], one WiFi-ed sensor [perhaps in a mesh] can reach
the outside world).
In case we want to measure Material stress some bandwidth needs to
be available: 6 float variables (acceleration [xyz] and angular
velocity [xyz]) and time . There will be some 15 Bytes JASON
overhead and some 40+45 Bytes MQTT overhead (in total some
110Bytes, quite a lot). So that is at least some
(7*4+110)*10*8bit/second : ~11kbit/sec. One could also store it on
a 8GByte SD card, would be worth of 325days of data.
If a webcam (high
speed WiFI), a fixed Internet or unlimited 4G SIM is needed (due
to link to streaming services).
If only a
magnetometer (LoRaWAN), revolution (LoRaWAN) and there is TTN (The
Things Network) access; no LoRaWAN gateway is needed.
If magnetometer
(LoRaWAN), revolution (LoRaWAN) and local weather station (WiFi),
a LoRaWAN gateway, is needed.
If LoRaWAN
gateway, one can use 4G or fixed Internet. If local weather
station needs a lot of bandwidth: a (un)limited SIM might be
needed (instead of a smartmeter SIM).
Extendibility/modularity of the mesh
Adding sensors to the mesh should be as easy as possible. At this
moment, when a sensor is connected, it will be included in the
platform.
Connectivity to the outside world
An Internet router (using: fixed, 4G or LoRaWAN) with the WiFi or possibly
the use of a wireless mesh (ESP-Mesh). Thus providing access to
database in the cloud using MQTT.
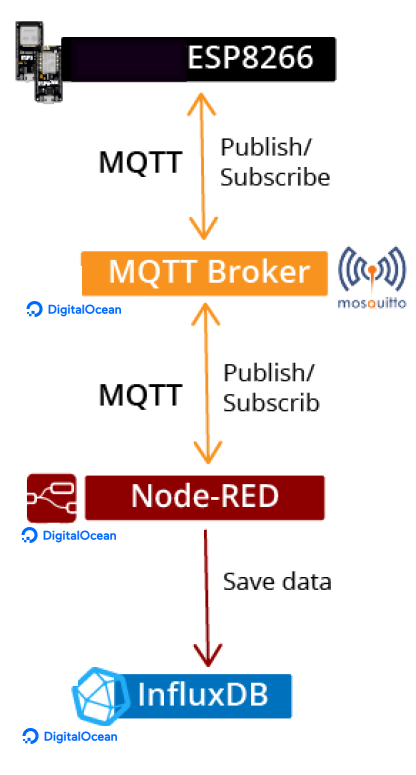
Software platform in the cloud
It would be nice if the smartmolen, Spinning mills and eMill projects are incorporated in
all of the above. Using some ideas (like Mosquitto, Node-RED and
InfluxDB on DigitalOcean) from this eBook. It is expected
that per mill one needs at max. some 10MByte additional storage
per month (120MByte/year).
Remark: The amount of Bytes needs to be
determined over the coming time.
Installation, support and maintenance
Clear agreements need to be made around this. Quality and
flexibility of the platform (at mill, cloud and service),
trustworthiness of the party managing the SlimmeMolen service,
confidence that the service will exist for a long time (5 to 10
years), good balance between costs and quality, support party that
is eager to do innovations.
Cost of SlimmeMolen sensors and services
Costs around: equipment, installation, support, maintenance,
cloud services, web services. A cost overview (using input from
smartmolen project) has been made based on: equipment,
support for a x year project (incl. CDF services), and a possible
student with academic links.
Linking with
weather prediction
Doing one's own measurements helps to support the interpretation
of weather prediction. So including an overview of weather
predictions (like KNMI weather charts
and service like Windfinder) are
important for the SlimmeMolen platform. See for some further
examples here.
The SlimmeMolen prototype
At this moment we have the
following IoT devices to prototype the SlimmeMolen platform: an
ESP8266 D1 Mini (Molen1, incl. WiFi to Internet), an
ESP8266 NodeMCU (Molen2, incl. WiFi to Internet); three
ESP8266 NodeMUC (Molen3, incl. WiFi to Internet) and four
ESP8266 plus one ESP32 (Molen4 incl. gateway between
ESP-Mesh and Internet).
These IoT devices send MQTT messages from the
following sensors: Temperatue&Humity&air Pressure
(BME280 and BMP180 [no humidity]); cap Direction (QMC5883L*); Acceleration and Revolutions
(MPU-6050); Lighting strikes (AS3935); presence Switches
(GPIO12 and GPIO14 of ESP8266); Real Time Clock X
(DS3231); Micro SD card; Battery status (ADC of
ESP8266); and WiFi or ESP-Mesh field strength (WiFi of
ESP8266).
Here is an overview of the boxes configured and running:
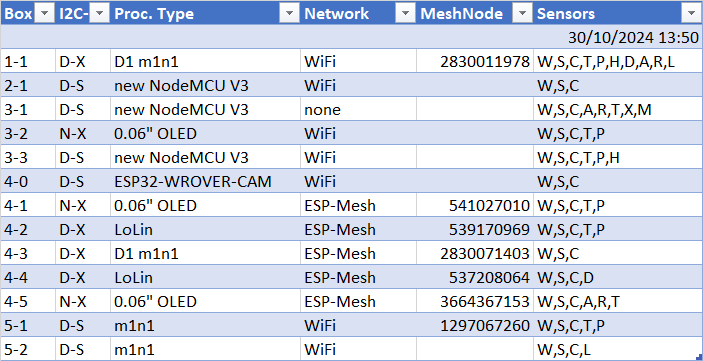
The IoT devices communicate through WiFi or ESP-Mesh; depending
which is possible/wanted.
The IoT devices' software has been built in such a way, that one
can include the sensors, I/O devices and local network one wants
at a mill (each processor will figure out itself which sensor(s)
it has). If there is no WiFi or ESP-Mesh connectivity, it can
still display the measured info on an local LCD (if plugged in) or
store on micro SD card.
The generated JSON data can be seen in Node-RED UI, InfluxDB (own server and
on Influx Cloud); on an LCD or OLED display; on a terminal
connected to the ESP8266s/ESP32s; or on a micro SD card.
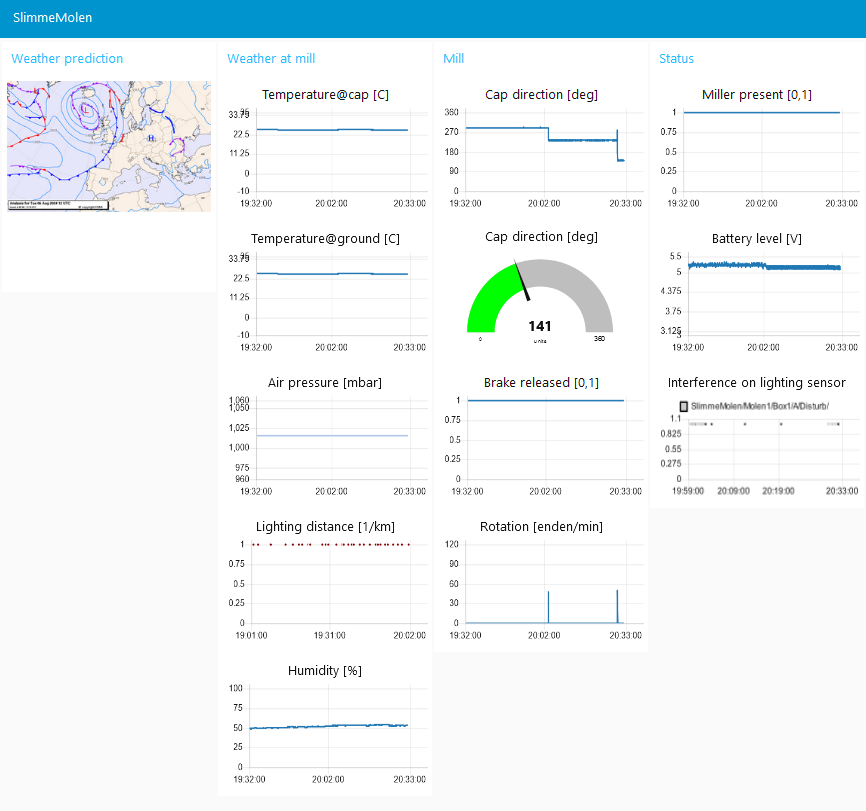
The below trial setup has been build up to now (for
ESP8266/ESP32 setup see here).
Real-time graphs generated from boxes with several sensors (at
this moment positioned at home) can be seen below.
The InfluxDB has been added (also running on DigitalOcean) to
store all (some 30) measurements at an interval of 10 seconds.
This to investigate the possible drift of the magnetometer over
two months time. Hopefully we can also measure temperature
gradients between a low and a high position with Molen4's
two temperature sensors (to check a theory of mine around
low pressure areas).
Experiences with the SlimmeMolen
prototype
The following experiences were registered (for most bullets the 'molen'
was in rooms of the house):
- General evaluation of the prototype:
- IoT devices, handy for the wind mill environment, were
succesfully implemented.
- The cloud services (with MQTT server [mosquitio],
programming tool for event-driven applications
[Node-RED] and database [InfluxDB]) behaved stable for some 30
days.
At a certain moment memory usage steeped up to 100%. I deleted
the largest data file and now InfluxDB, Node-RED and Node-RED
dashboard are accessible again.
Need to determine why the InfluxDB database grows fast
(the first 55 days of InfluxDB data 4GByte and the last
few 10 days around 100MByte/day/2mills, we need to compare
this to the 4.5MByte of JSON messages that are generated
with the Boxes/day/2mills; why is there a difference of a
factor of 20!?)...
- Slowly (after the first 12 days) the IoT devices got more
and more stable (looking at software updates and hanging
devices). Sometimes a single sensor on an ESP8266 stops, while
the others continue. But after some 20 days it now looks all
ok.
- WiFi provides a stable network and connectivity to the MQTT
broker.
- ESP-Mesh is
working (there is still some lack of convergence). Its
interconnectivity with Internet is implemented using one
ESP8266 (as master on ESP-Mesh side) and one ESP32 (as slave
on Internet side).
- ESP-Mesh improves the coverage, due to its inherent meshing.
When having an additional intermediate node, the range is
increased (so one intermdiate node: double distance to gateway
node, two intermediate nodes: triple distance to gateway node,
ect.).
Here is a sample ESP-Mesh network (of Molen4, with
four boxes B1 to B4):
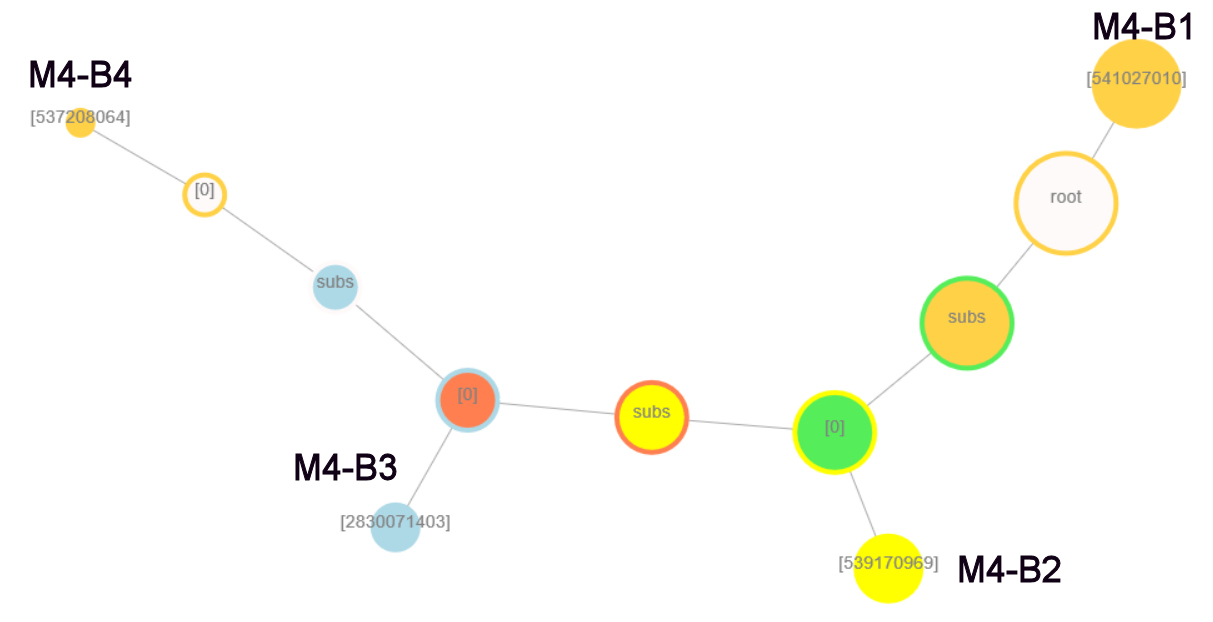
B1 (the ESP-Mesh gateway) is conncted to the Internet.
- It looks the maximum message size of I2C packet
is 128Byte (while it should be much much larger). I experience
this when sending data from ESP8266 to ESP32 (over an I2C link
using Wire.h). The maximum message size of I2C? is
indeed 128Bytes (#define
I2C_BUFFER_LENGTH 128).
Remark: For now split the messages (but perhaps
recompile Wire.h is better).
- The MQTT maximum packet size, which is by default 128Byte (my
experience is not 256!). If needed, increase this
buffersize (setBufferSize).
- Make sure that the keepalives (setSocketTimeout and
setKeepAlive) in MQTT are set according to the
measurement interval of sensor readings (aka MQTT messages).
- Application experiences
- InfluxDB needs considerable free disc memory (when not
enough disc space, the whole systems becomes very slow) and
also is greedy on RAM memory (minimum 1GByte needed).
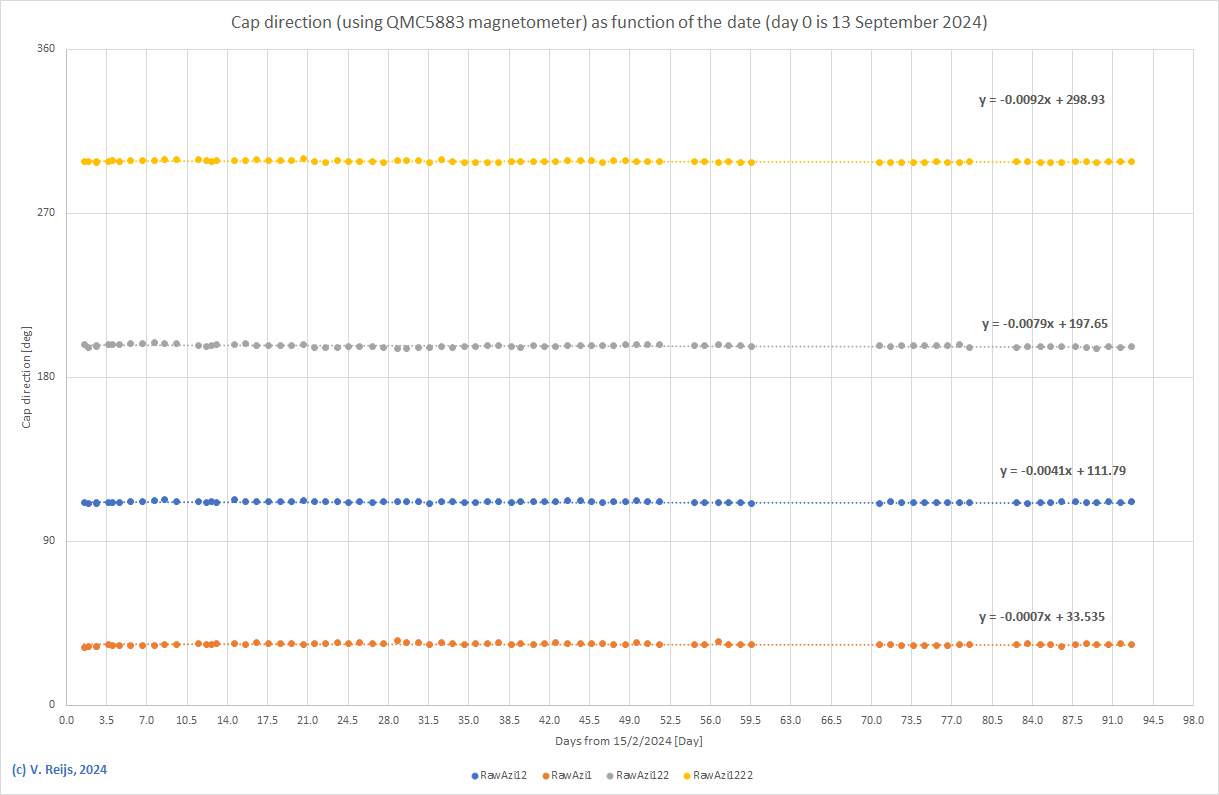
- Sensor evaluation for four directions:
- It looks the direction readings (magnetometer QMC5883) have some drift for certain
direction(s):
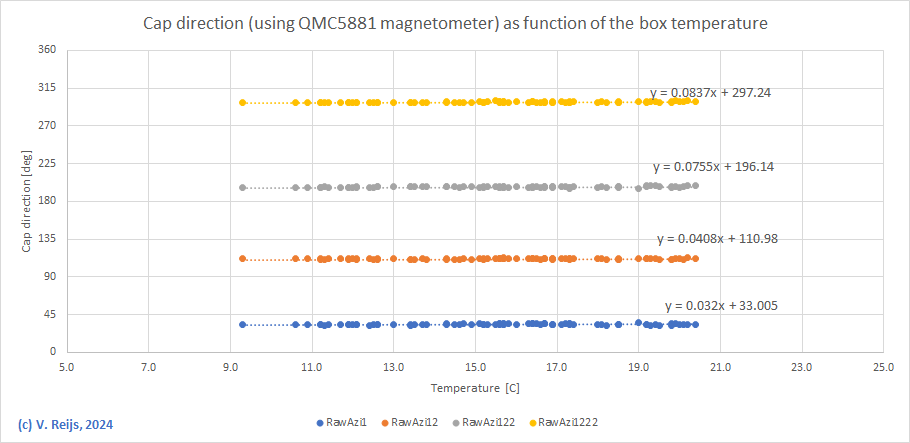
- Stability looking at the temperature
of magnetometer (QMC5883):
- If using the data between 15/9/2024 and 15/12/2024, and we
optmise for temperature and date we get the equation:
Dir = a1 * Days + a2 * Temp + b [deg]
Dir
|
a1
Days from
13/9/2024
|
a2
Temp [C]
|
b
Dir @ 0C &
13/9/2024
|
1σ
|
4
|
-0.003
|
0.06
|
297.7
|
0.6
|
3
|
-0.003
|
0.05
|
196.6
|
0.7
|
2
|
-0.002
|
0.03
|
111.3
|
0.5
|
1
|
0.001
|
0.02
|
33.1
|
0.7
|
So no signifcant influence due to the date of measurements
(which is as hoped/expected), The temperature has some
influence. From above table: 10C some 0.4deg direction change.
Looking at the sensor's specs: which has
is 0.05%/C; this would results per 10C in a direction change
of some 0.15deg. So they are in the same order.
- It would be good to test the
LMS303DLHC or BMX160 (which is used in the smartmolen
project). Not planned for this prototype.
- Even a small screw (at a distance of some 10cm) or vacuuming
(at some 60cm) can change the direction with a few degrees. A
metal hose rack was on the other side
of the shed wall and its influence depending on distance can
be seen here:
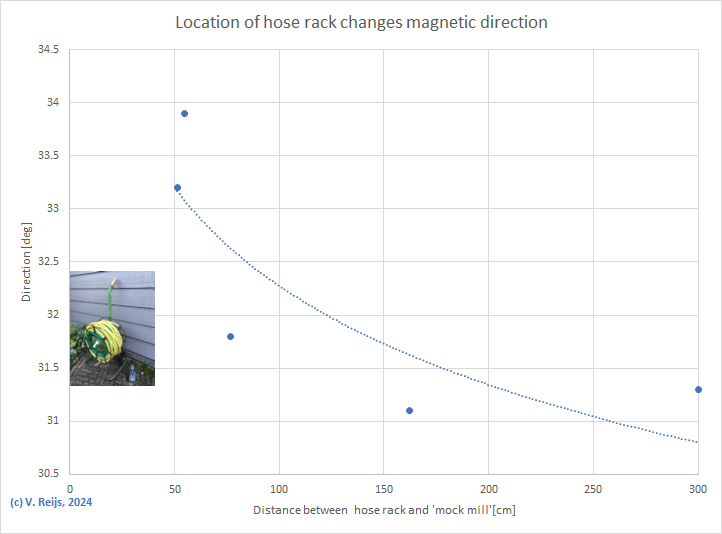
A variation of some 3 degrees can be seen. So make sure your
magnetometer is as far away as possible from hard and soft metals.
So watch out for metal in the cap of the mill (brake wheel,
wind shaft, winding mechanism (rolls, rails, etc.), support
structures, etc.)!
- Remark: on the Internet BME280 and BMP280 are many times
mentioned together in e-shops. But be aware the BMP280 can
only do temperature and pressure, while the BME280 does
temperature, humidity and pressure! They also need different
libraries!
- Some integrated OLEDs on ESP8266 use the default I2C
GPIO ports (SDA=D4, SCL=D5) while other use different ones
(SDA=D14, SCL=D12)!
- Experience gained with the lighting detector is not yet
fully satisfactory.
The capacitor (parallel to the antenna) is too
large in one sensors I have, so calibration did not work (see at the bottom of
this link). I have informed the shop about this; they
plan to send me a new device. In the meantime I replaced the
existing capacitors with some 970pF (I am though not that good
in SMD soldering...). Now the calibration looks more robust.
BUT: over the days the capacitance or inductance
(aka resonance frequency) seems to drift! The trend (of Molen5
and Molen1) of the drift can be followed on the dashboard.
Remark: Need
to check the sensor (AS3935) during thunder
storms. Hopefully in the coming
autumn/winter weeks.
- WiFi/ESP-Mesh coverage (aim to have excellent/good strength
in/near the mill body):
- The WiFi /ESP-Mesh distance range is not large (with some devices
only 5m, in other devices around 15m); one wall/floor
already reduces 50% of the needed field strength. Most ESP8266
development boards do not have a large WiFi dynamic range.
- Determine the influence of an external aerial.
This is not easy to compare, as the WiFI RSSI value is quite
variable. Had a two ESP8266 D1 mini (ESPa [with different
aerial configurations: Box 5-1] and ESPb [always on board
aerial, Box 5-2]) and one ESP8266 D1 Pro mini (ESPc with
external aerial). The aerials were on the table (some 10cm
between them two) and some 5m from repeater.
Four aerial confurations for ESPa and ESPc were tested: on
board aerial; only aerial cable (19cm long); short (19+8cm)
aerial; long (19+18cm) aerial.
Aerial of
ESP-1
|
RSSI
ESPa
|
RSSI
ESPb
|
RSSI
ESPc
|
RSSI
Difference
|
Test 1 (both
on board)
|
on board
|
-57
|
-59
|
|
2
|
Test 2a
(ESPa cable inline with aerial)
|
only aerial
cable
|
-50
|
-60
|
|
10
|
+short aerial
|
-49
|
-60.5
|
|
11.5
|
+long aerial
|
-48
|
-59
|
|
10
|
| Test 2b
(ESPa cable inline with aerial) |
only aerial
cable
|
-49
|
-55
|
|
6
|
+short aerial
|
-49.5
|
-56.5
|
|
7
|
+long aerial
|
-47
|
-57
|
|
10
|
Test 3 (ESPb
cable perpendicular to aerial)
|
only aerial
cable
|
-52
|
-61
|
|
9
|
+short aerial
|
-49.5
|
-62.5
|
|
13
|
+long aerial
|
-48.5
|
-62
|
|
14.5
|
| Test 4 (ESPc
with external aerial) |
| only aerial
cable |
|
|
-58.5
|
|
| +short aerial |
|
|
-59
|
|
| +long aerial |
|
|
-64
|
|
As you case there is considerable variation. But on average an
external aerial (including the cable) give some 8 (between 5
and 12dB) improvement, seen from an onboard aerial. This migth
result in some 2 to 6m more in distance (assuming normal
distance of WiFi is 10 to 30m).
ESPc has a much worse sensitivity than ESPa and ESPb.
- Several boxes were tested on their
sensitivity. Box 5-1 has an external antenna, while the other
boxes have the integrated antenna. The access point (Box 4-1)
was at the end of the garage (0m) and the other Boxes under
test was moved through garage into the outside (upto around
15.5m).
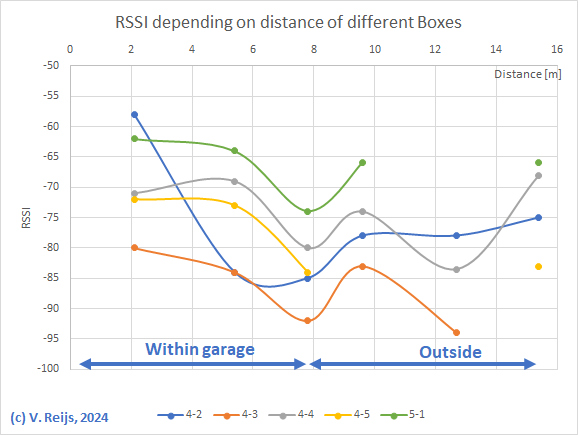
Remember that RSSI is not defined in dBm
(but something proprietary). When no connectivity was seen, no
point/line is seen in above graph.
At a distance of some 7m (at start of the garage) the RSSI
reduces for all boxes, but when moving the boxes outside the
garage, the RSSI increases somewhat. Interestingly two boxes
(4-3 and 5-1) were seen at some 15.5m, while for shorter
distances they were not seen...
- Longer convergance tests are
needed with the ESP-Mesh, when nodes are
added/removed/restarted. This is now looking better (after
including MQTT timers and restarting an ESP-Mesh if a long
time only 1 node in an ESP-Mesh). The convergence can take 1
to 15 min or more! for an ESP-Mesh of five nodes....
A new version of ESP-Mesh was made for me (1.5.4). It now
converges much faster (1 or 2 minutes for 5 nodes). But
there is still some instability...
Need to check how stable this new version is in the coming
weeks.
- Battery life (aim a quarter or half a year):
- Using WiFI, ESP-Mesh and other chips on the ESP8266
development boards use much power (a WiFi module needs between
60 and 90mA; and the other chips around 4 to 20mA). Sleeping
IoT devies will thus still see around 4 to 20mA; still a lot
on average.
Perhaps better to use the ESP-12F (or
ESP32 variant?), but it is not expected that this will
be prototyped.
- It looks that some device brands
don't revive after a Deep Sleep. I was able to get it
working for a few device source.
I have informed the shop(s) about this.
- Deep Sleeping can only be used effectively if there is no
hopping/meshing happening. Leaf nodes tothe mesh can be
Deep Sleeping (like the one in the rotating mill cap).
- Alternative is to use mains where possible, this is
difficult for devices in the rotating mill cap!
- To improve battery life; LoRaWAN
should be a better alternative then WiFi and/or ESP-Mesh.
It is not expected that this will be
prototyped.
- Cost of the prototype
Eight ESP8266 (@ ~3Euro), one ESP32 (@ ~6Euro), ten sensors (@
~5Euro), two breadboards (@ ~2Euro), USB and jumper cables
(total ~10Euro): total around 100Euro.
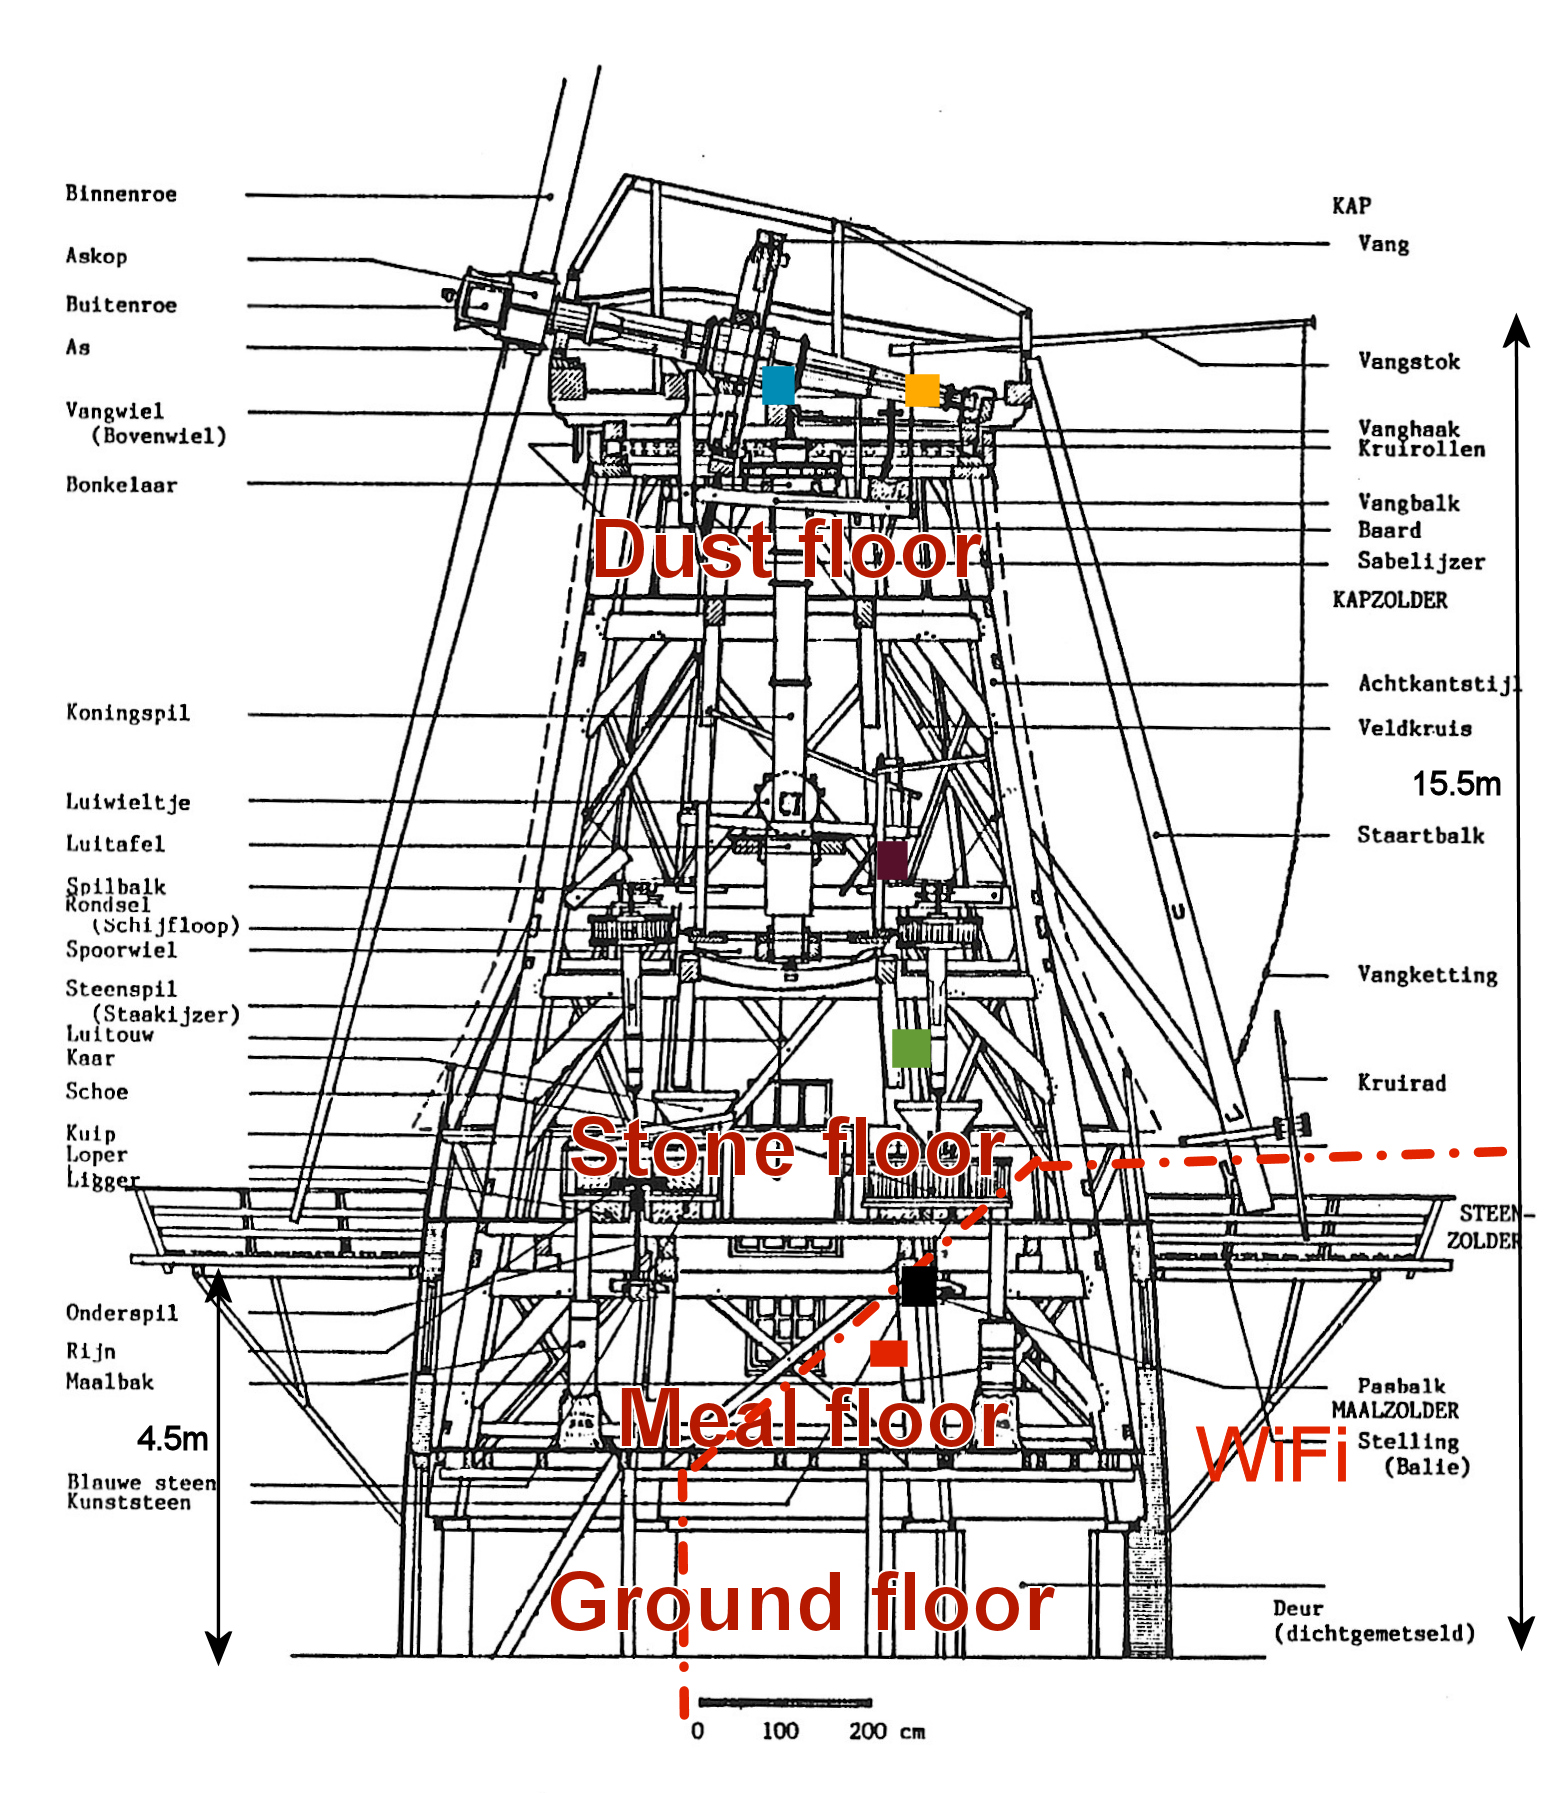
- Experience at actual wind mills
- Four boxes with sensors (Molen4)
were placed at De Zwiepse Molen
on Sept. 7th, 2024. Molen4's data could have been seen
live at this dashboard.
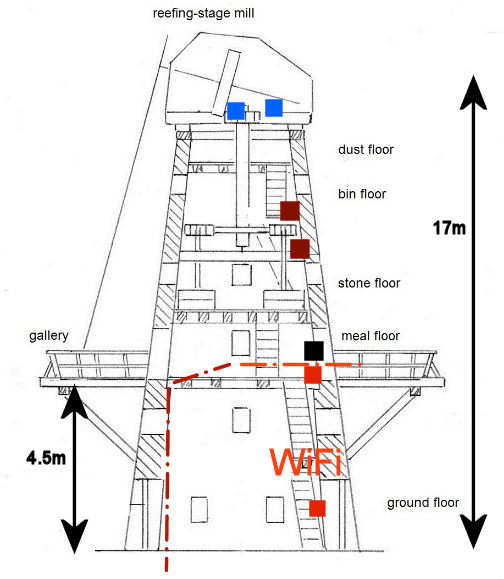
- Sensor boxes at:
- the ground floor (red: first
temperature/humidity/pressure sensor, miller presence and
gateway between WiFi/Internet and ESP-Mesh; connected to
battery);
- half way the meal floor (black: act as repeater;
connected to mains);
- the stone floor (brown: second temperature
/humidity/pressure sensor; connected to mains); and
- dust floor on the beam or on the wallover (light blue:
magnetometer, brake release, lightning detector; connected
to battery).
- Internet was available with WiFi up to the bottom part of
meal floor. Mesh-ESP was used between the four boxes.
- Most of the time the ESP-mesh was stable. By slight
rearranging the boxes the connectivity was made stable.
- Once in a while the connection with the MQTT server (on
the gateway) was lost, but the system reconnected
succesfully. Reason yet unknown (WiFi connectivity was
available).
- Box on the left beam did not connect, but on the right
beam and on the wallover it connected. Perhaps the stone
floor box (brown) should be on the bin floor or on the
fixed dust floor itself (also better to get a higher
position for the second temperature sensor).
- Fifth boxes with
sensors might be placed at Westermolen on Sept. 21st and 28th,
2024.
- Tests on 21 Sept:
- at height of sack hoist friction table (5-1
purple: act as repeater; connected to laptop battery);
- on the windshaft (4-5 yellow: rotation; connected to
battery);
- Experience:
- Internet connectivity (WiFi) is available at the table
on the meal floor.
- Box 4-5 rotated with the windshaft (although during
the tests the windshaft only rotated once or twice:-(
- First Box 5-1 was on top of the hopper, ESP-Mesh RSSI
around -90 (~8m distance); this resulted sometimes in
losing connectivity. Then moved Box 5-1 to the
height of the friction table, this resulted in a
ESP-Mesh RSSI of -60 to -70 (~5m distance; depending on
position of Box 4-5 on the lowest or heighest point of
box/jar on the shaft). Connectivity was satisfactory.
- Tests on 28 Sept:
- Sensors:
- at the table of the meal floor (4-1 red: first
temperature/humidity sensor, miller presence and gateway
between WiFi/Internet and ESP-Mesh; connected to
battery);
- half way up the meal floor (4-2 black: act as repeater
with no sensors; connected to mains);
- half way up the stone floor (4-3 green: act as
repeater with no sensors; connected to mains);
- at height of sack hoist friction table (5-1 purple:
act as repeater with no sensors; connected to battery);
- dust floor on the beam (4-4 light blue: magnetometer,
brake release, connected to battery);
- on the windshaft (4-5 yellow: rotation, accelerator
and third temperature; connected to battery);
- Experience:
- No connectivity was possible with the database
(InflxDB) in the cloud, as there was a problem with that
cloud-service.
- For a short time (3min!) all but one box had
connectivity to the ESP-Mesh towards the Internet.
Except Box 4-3; it was not included as there was a
direct ESP-Mesh connection between 4-2 and 5-1
('skipping' the Stone floor).
- But it was not a very stable connection. After moving
a box, the maximum number of Boxes seen was 3 (instead
of 5).
More study/experience would
be needed to get this stable. This
stability of the ESP-Mesh was unsatisfactory;
new software have been received in the meantime.
Duration tests are being performed. Perhaps
using LoRaWAN (which is expected not to be tested
with this prototype).
- So it was possible to get every sensor box involved.
- One a rotation as high as 71.7 ends/min was recorded
by Box 4-5 (there was wind force 4Bft).
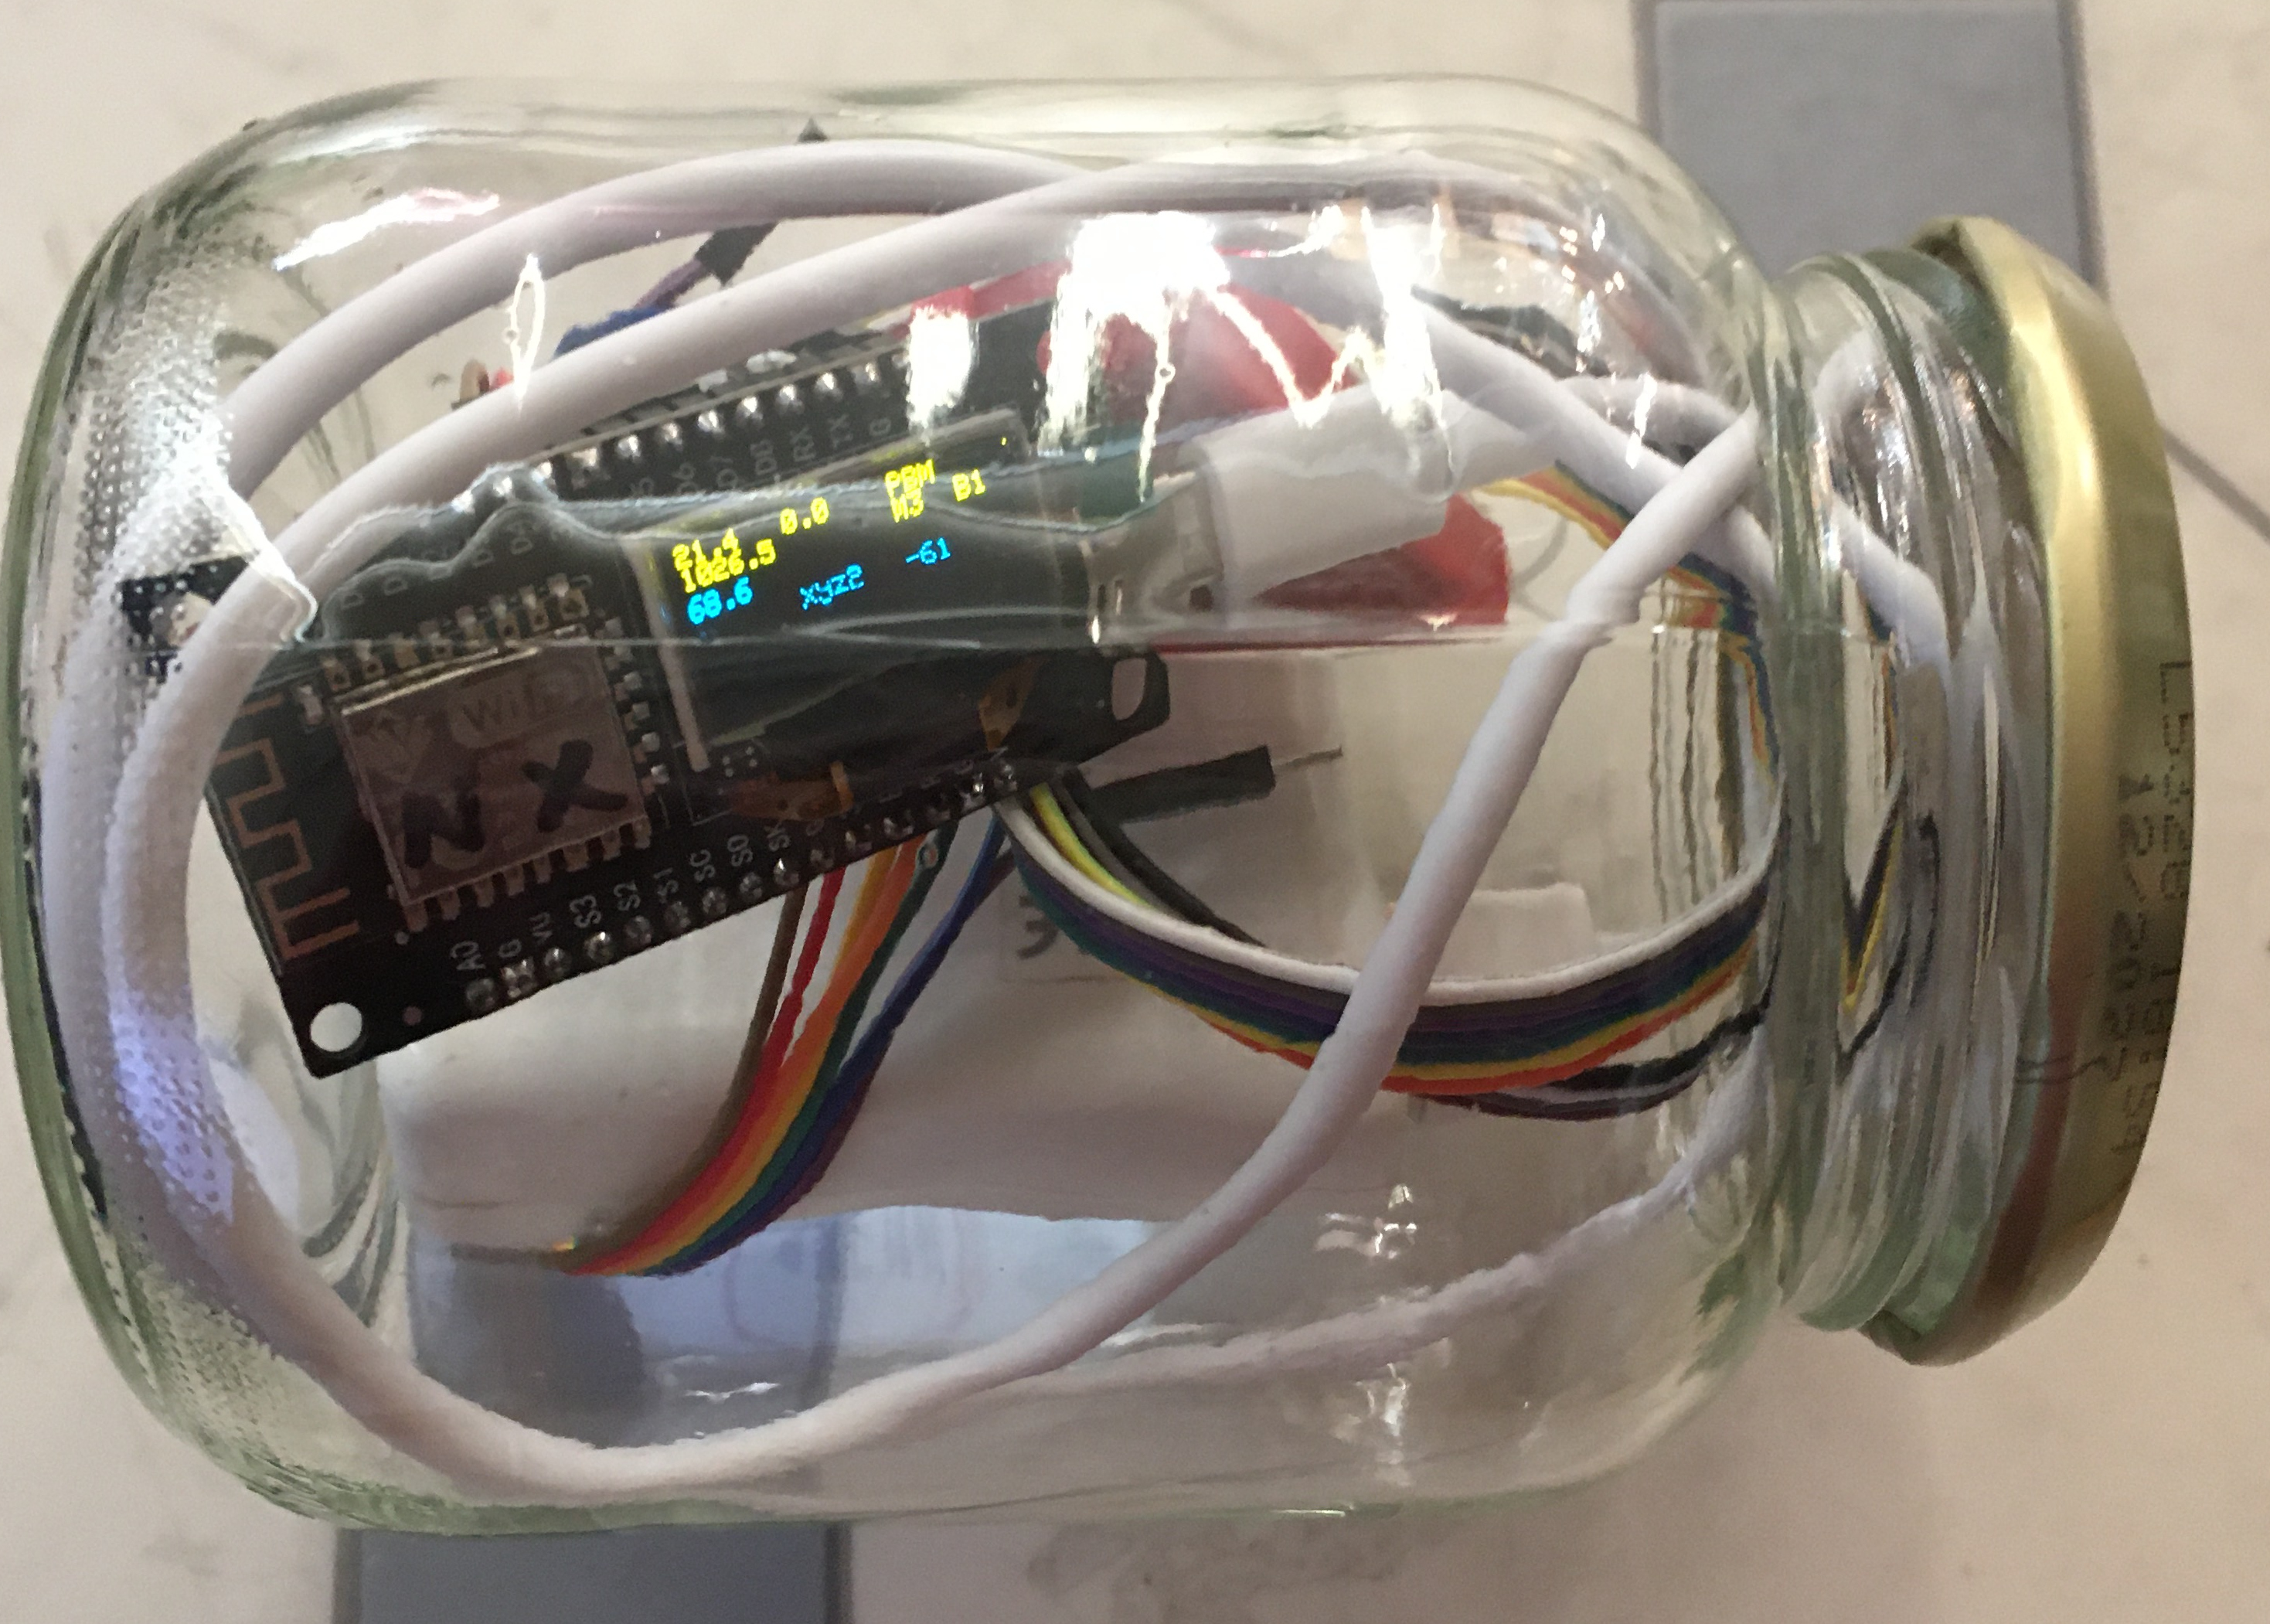
- The acceleration
and rotation (using Box 3-1) was measured at the tip of the
sail (at De Zwiepse Molen on Oct. 2nd). The ESP8266+sensor
(MPU-6050) and an iPhone (with the Sensor Logger App)
simultanously measures these; to compare the results. De
MPU-6050 was sampled 10times/sec, while the iPhone was
sampling at 100times/sec.
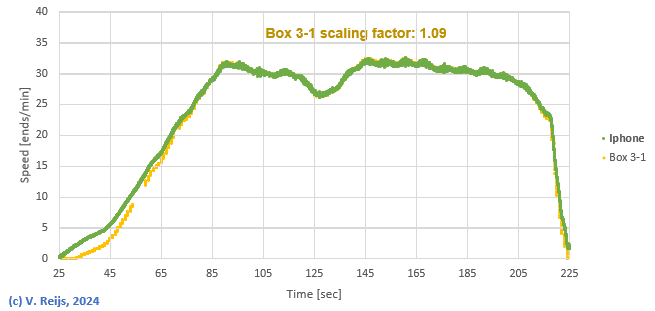
The offset (at rest) of the MPU-6050 rotation's magnitude
readings has been removed. Furthermore a scaling factor of
around 9% on the MPU-6050 readings was needed to get the same
magnitude rotation readings as with the iPhone. A 3% scaling tolerance
is mentioned in the MPU-6050 spec.
At speeds above around 20ends/min the values look to match,
below that the MPU-6050 differs more from the iPhone. It has
not yet been determined which of the devices was closest to
reality. There migth be non-linearity in one of the devices
(in MPU-6050 specification non linearity is around 0.2%).
If we compare the acceleration of iPhone
(uncallibrated) and ESP8266+sensor, we get:

The forms of the curve look similar. Both the
iPhone and the ESP8266+sensor are uncalibrated. Calibration
would be needed. Remember that the sensor-chips of the two
devices migth not have been aligned in the same way, so some
differences in x, y and z are likely have happened.
For this prototype the
accuracy of acceleration and speed is ok-ish, but it is
expected improvements (by calibrating) can be made.
- Measure
temperatures at different heights and see how this
links with low pressure regions
and rain
Problemen
- Lost WiFi connectivity
Distance too long (in new situation). The moisture/humidy level
could have been too high (see white
power). Use Contact spray.
- White powder on the PCB
Humidity/moisture is a logical reason (as the procesoors are
outside in open air). Use Contact spray. The ESP8266s were out
almost a year.
- A lot of Noise or Disturbances on AS3935 (M1B1, M5B2)
This is likely to be the noise coming from the switching power
supply (SPMS [Switched-Mode
Power Supply]). One needs to use an analogue
(non switching) powersupply. Or add ferrit on the power supply
lead (not tried yet).
- DuPont/jumper wires
These are nice for eperimenting, but not good enough for
operational service (connects are sometimes flacky). Use
soldering.
- The USB battery bank (13wH: 2600mAh) had a lame USB connector
(Nov. 2025)
- The outside isolation of cable towards the USB Type A
connector breaks (due to cold and/or due to bending when
replacing rechargeable battery?). Buy better cables or reenforce
with self-vulcanizing tape.
- USB micro male connector of cable becomes loose on the BCP USB
micro female connector on the ESP8266 (M3B3).
The springs on the cable's USB micro don't function properly.
- Sometimes the readings of temperature, pressure and humidity
(M5B1) stays the same for considerable time (upto 2 to 7hours).
Need to investigate
References
Benschop, Henk: Representativiteit windmetingen, in het
bijzonder op luchthavens. In: (2005a), issue KNMI Technisch
Rapport TR-277.
Benschop, Henk, Meulen Jitze van der: Quality and representativity of wind
measurements. In: (2005b), Instruments and Observing Methods
Report No. 82: Papers presented at the WMO Technical Conference on
Meteorological and Environmental Instruments and Methods of
Observation, WMO/TD-No. 1265, pp 876-886.
Acknowledgements
I would like to thank people, such as Justin Coomb,
Rien Eykelenboom and others for their help, encouragement
and/or constructive feedback. Any remaining errors in
methodology or results are my responsibility of course!!! If you
want to provide constructive feedback, please let me know.
Major content related
changes: March 21, 2024