Simuleren van wind bij De Hoop, Den Oever
Simuleren van wind
bij De Hoop, Den Oever by Victor Reijs
is licensed under CC BY-NC-SA 4.0


Introductie
Deze web pagina is bedoeld om iemand te helpen om met CFD een
simulatie van de wind te doen voor een traditionele windmolen.
Hulp kan natuurlijk altijd gevraagd worden.
Als voorbeeld is op deze web pagina een simulatie voor molen De Hoop in Den Oever.
Er zijn nog wat andere voorbeelden: Makkinga's Mölle
(voorheen Den Oord, Ommen), De Zwiepse Molen (Zwiep) en Impington Mill
(Impington).
Deze webpagina heeft de volgende paragrafen:
Sorry for the two langauges gebruikt in deze webpagina!
Vette paarse tekst heeft nog extra
aandacht nodig.
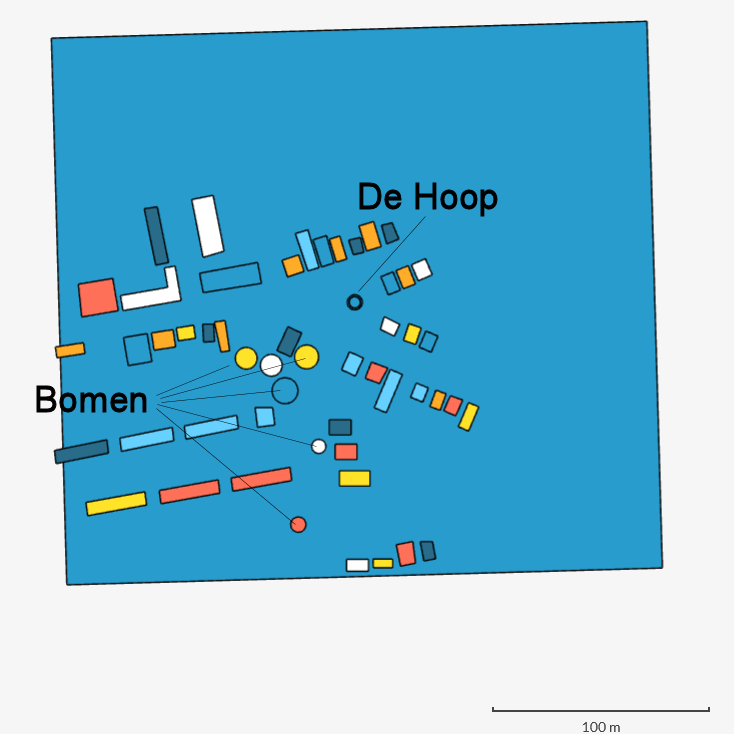
Informatie over de molen omgeving
- De Hoop in Den Oever.
- Height of the wind shaft 9.7m from ground/street level
- Sail span is 17m
- The ABL wind speed is 7.09m/sec@10m and z0 of 0.5m
(parkland aanstroom gebied).
- CFD wordt gedaan tussen 170 en 260deg (zodat een goede
[weighted] vergelijking gedaan kan worden met windmetingen
tussen 180 en 250deg).
Eigenschappen van obstakels
- Gebruikt de DSM van Nederland (AHN: systematische
fout: 8cm, 1 sigma: 5cm)
- Voor een glooiende omgeving volgt de wind verdeling (ABL) het
terrein, dus de hoogte is ten opzichte van lokale grondniveau.
- Bepaal hoogte/grootte van gewenste/invloedrijke (huizen/bomen
zeg hoger dan 7m) obstakels t.o.v. de lokale grond ('Minimum')
niveau: 'Analyse' -> 'Lijn' of 'Polygon' (zorg ervoor dat
'Lijn' of 'Polygon' ook de lokale grond bevatten, zodat men dat
kan compenseren ('Maximum' - 'Minimum').
- De grootte van bomen veranderd in de tijd. Check de datum van
de DSM en compenseer eventueel (0.5m/jaar voor de
meeste bomen bij De Hoop).
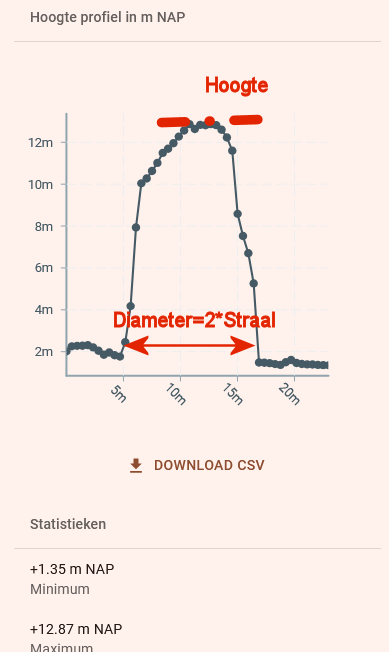
- Bepaal diameter van bomen m.b.v. 'Analyse' -> 'Lijn'.
- Voor (elke) bomen: bepaal wat voor
boomsoort het is (dit in verband met bladverliezend en
porositeit).
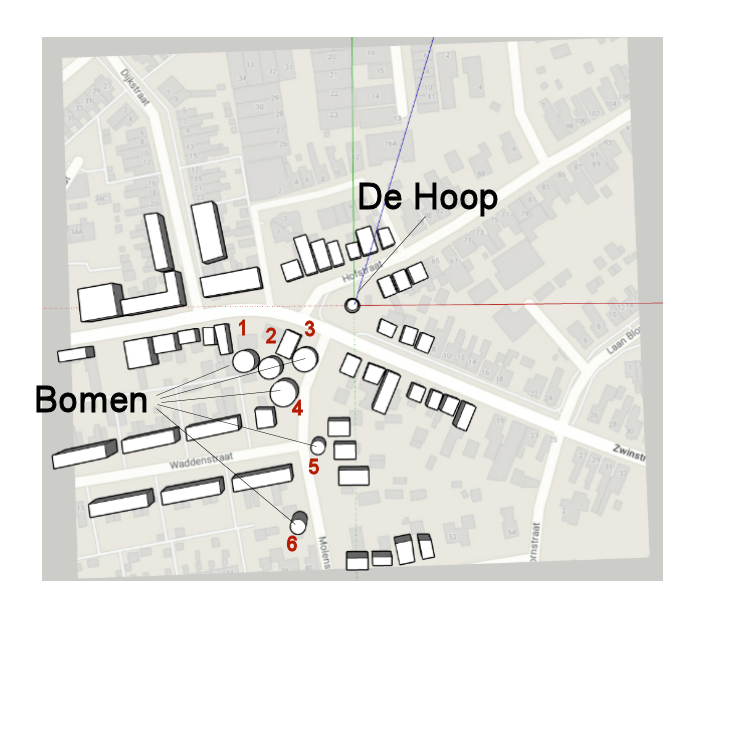
Vlakbij De Hoop staat een treurwilg (Boom1) en drie Esdoorns
(Boom2, 3 en 4). Alle zijn bladverliezend.
Verder zijn het Cat. 1B bomen (tussen 12 en
20m grootte).
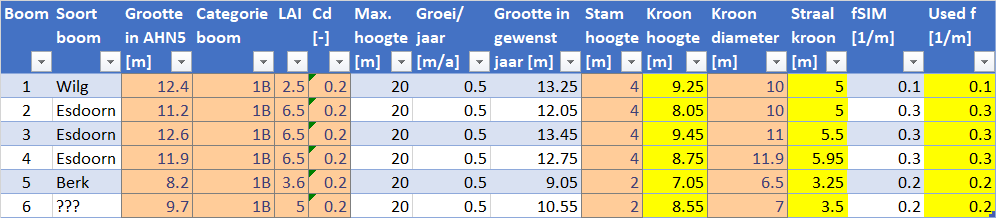
LAI: Leaf Area Index (see for some examples here [Section 2
'Tree Model'], but the LAI Woody Plant
Database has been used)
f: Forchheimer coefficient (somthing related to porosity)
De verhouding stam hoogte en boom grootte is voor volwassen
bomen 1
op 1. Maar er zullen meestal ook struiken (tot 6m)
onder bomen, in een tuin, staan. Dit verdient nog aandacht.
Remark: The value of Cd is not known with
certainty, but SIMSCALE's default has been used
of 0.2 as default.
- Effort: 2 hours.
Maken 3D model in SketchUp
Gebruik makend van SketchUp Web App:
- Zet in 'Model Info' -> 'Length Units' op 'Meter' ->
'Display Precision' op 0.01m -> 'LengthSnapping' ook op 0.01m
- 'Add location' -> 'Select Region' -> Selecteer de juiste
regio rondom molen De Hoop (een regio van 800*800m is standaard,
met de molen in het midden) -> 'Import'
- In het gebied van de windrichtingen (170 tot 290deg) komen
alle gewenste/invloedrijke obstakels. Maar ook obstakels in de
tegenovergestelde richting, over een afstand van op zijn minst
5*hoogste obstakel hoogte/grootte.
Voor deze simulatie zal een beperkt windrichtingen en gebied
meegenomen worden: zo'n 150m tegen de windrichting (in west-zuid
sector) en 50m met de windrichting (in oost-noord sector).
- Zet gebouwen neer door contouren (polygon) met 'Line' te
volgen in 'Location Snapshot' (zorg dat de lijn op 'On face in
Location Snapshot' komt). Gebruik 'Push/pull' om de hoogte van
gebouw in te stellen; makkelijkste door de hoogte (in meter)
intypen.
Remark: de effectieve hoogte
van gebouwen: is dat de nok hoogte of halverwege dak
hoogte, of zou het dak gemodelleerd moeten worden? Dit
laatste is hoogstwaarschijnlijk nodig voor gebouwen dicht
bij de molen.
Remark: welke gebouwen?: alle binnen de 400m straal of
alleen de meest invloedrijke(n). In STworkflow
(3 meest invloedrijke); DHMworkflow (1 meest
invloedrijke); VR workflow (alle gewenste
gebouwen in 400m straal).
- Zet het molenlichaam als een cirkel (Circle), en type de
Radius (straal in meter) van beneden vloer in. Gebruik
'Push/pull' om de hoogte van molenkap in te stellen,
makkelijkste door de hoogte (in meter) intypen. Gebruik 'Select'
om bovenste vlak(dak) van molen te selecteren; en daarna 'Scale'
en gebruik 'CTRL' - 'Uniform Scale about Center' om de scaling
naar kapvloer straal te maken ('Scale' =
kapvloerstraal/benedenvloerstraal).
- Plaats de bomen (als rechte cilinders) door: 'Circle' met
straal en 'Push/pull' voor (grootte-stamhoogte). Daarna verhef
('Move') de cilinder met de stamhoogte.
Bomen zijn dus cilinders, die zo'n 2m (stamhoogte) verheven zijn
boven de grond.
Remark: welke bomen?: alle binnen de
400m straal of alleen de meest invloedrijke(n). In
STworkflow (3 meest invloedrijke); DHMworkflow (1 meest
invloedrijke); VR workflow (alle gewenste bomen in 400m).
- Het 3D-model ziet er nu zo uit:
- Sluit af als klaar: 'Save' en 'Download' -> 'STL'
- Effort: 4 hours.
Editing 3D-model in SIMSCALE
We are making use of SIMSCALE. Make sure
you make a Community Plan
account. This Community Plan allows only for 10 simulations (but
one can do more; but with more manual work). Anyway make sure
you have a good CAD-model and that you train/educate yourself around SIMSCALE.
The following steps can be done:
- Het simulatie project staat hier.
- Import het STL
model
- Edit this (not yet rotated) model by: Edit a copy
- Delete the 'Location Snapshot' (a Sheet in SIMSCALE)
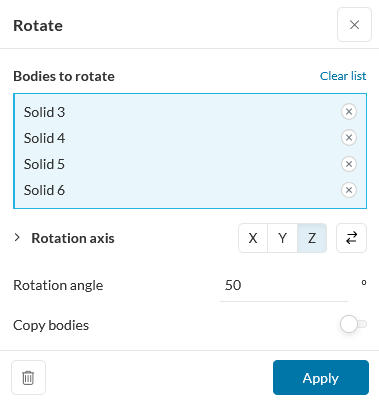
- Select All and Transform -> Rotate om de Z-hoek
(say 50deg; windrichting 230 [=180+50] deg) om de
heersende windrichting te veranderen.
- Make a Flow Volume -> External waarbij de
poreuze objecten (bomen: 'Excluded parts') niet deelnemen aan
het 'External flow volume'.
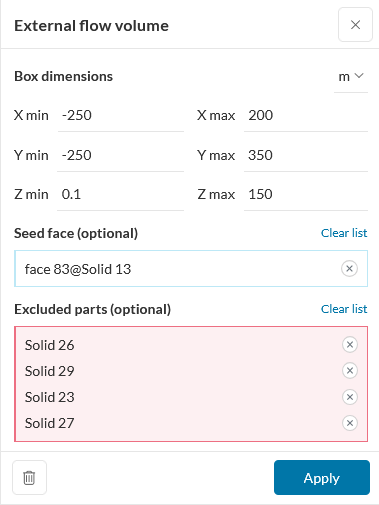
Zie voor richtlijnen mbt vrije afstanden rondom het model
hier [Franke,
2007]:
- Xmin, Xmax: minimaal 5*hoogte/grootte hoogste
obstakel [Franke, 2007, page 17] extra aan linker en rechter
kant van 3D-model. In dit geval ~5*~20m (molen): ~ 150m
- Ymin: Distance in front of model (in Y-direction)
minimaal 8*hoogte/grootte hoogste obstakel [Franke, 2007,
page 18] extra aan voorkant van 3D-model. In dit geval
~8*~20m (molen): ~ 150m
- Ymax: Distance at back of model (in Y-direction)
minimaal 15*hoogte/grootte hoogste obstakel [Franke, 2007,
page 18] extra aan achterkant van 3D-model. In dit geval
~15*~20m (molen): ~ 300m
- Zmin: Ground (in Z-direction) minimaal om invloed
van modelerings afrondingen te voorkomen: ~ 0.1m
- Zmax: Height (in Z-direction) minimaal
6*hoogte/grootte hoogste obstakel [Franke, 2007, page 17].
In dit geval ~6*~20m (molen): ~ 150m
- By the way, the default values in SIMSCALE were always
somewhat larger than the above, so its defaults are also ok.
Except for Zmin; I would put that always at 0.1m.
- Delete alle gebouwen (dus niet de bomen)
- Save
- Effort: 2 hours.
Configureren van de CFD
Take the following steps (if not default, it is explicitly
mentioned in below steps):
- Goto SIMULATIONS +
- Incompressible -> Turbulence-model -> Realizable
k-epsilon [Franke, 2007, page 14]
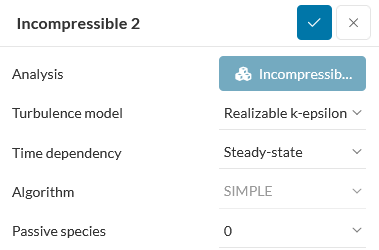
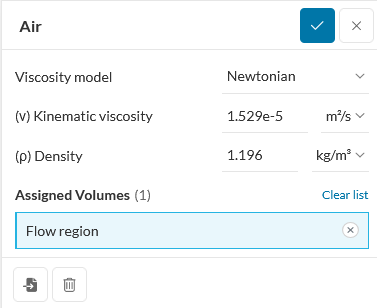
- Materials -> Air -> Apply
Assigned Volumes -> Flow region
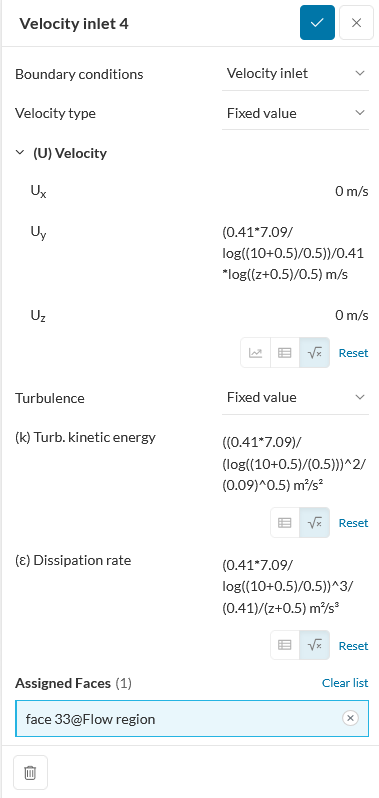
- Boundary conditions
- Velocity Inlet
Assigned Faces -> the wind side
(U) Velocity -> Uy -> ABL Formula (7.09m/sec at 10m
and z0=0.5m [the ABL of the incoming wind:
'parkland']]
(0.41*7.09/log((10+0.5)/0.5))/0.41*log((z+0.5)/0.5)
Turbulence -> Fixed value
(k) Turb. kinetic energy -> ABL derived Formula
((0.41*7.09)/(log((10+0.5)/(0.5)))^2/(0.09)^0.5)
(ε) Dissipation rate -> ABL derived Formula
(0.41*7.09/log((10+0.5)/0.5))^3/(0.41)/(z+0.5)
Save
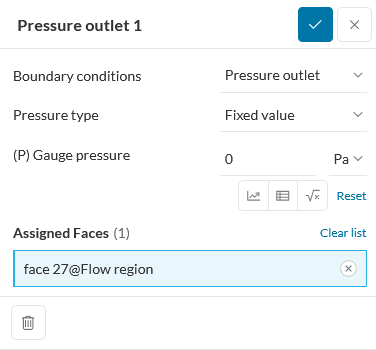
- Pressure outlet
Assigned Faces -> opposite inlet side
Save
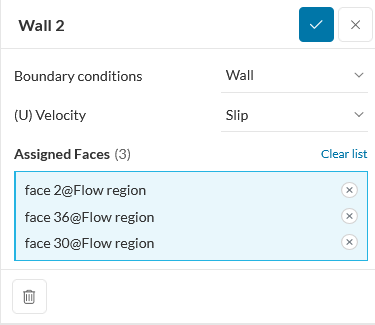
- Wall
Assigned Faces -> two sides and top
(U) Velocity -> Slip
Save
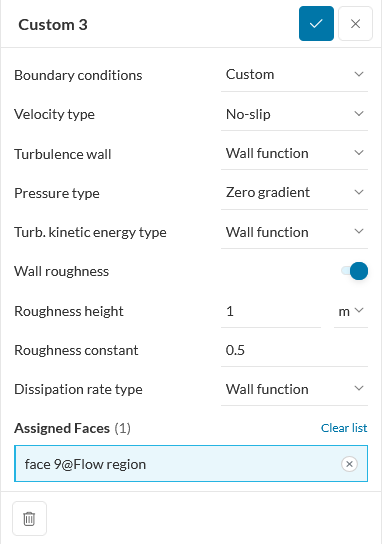
- Custom (ground)
Assigned Faces -> bottom side
Wall roughness -> On
Roughness height -> 1m (values of 0.1 and 5m have
been tried to get a stable ABL at start of Flow Volume:
but this parameter has no significant influence, so default is
used)
Roughness constant -> 0.5
Save
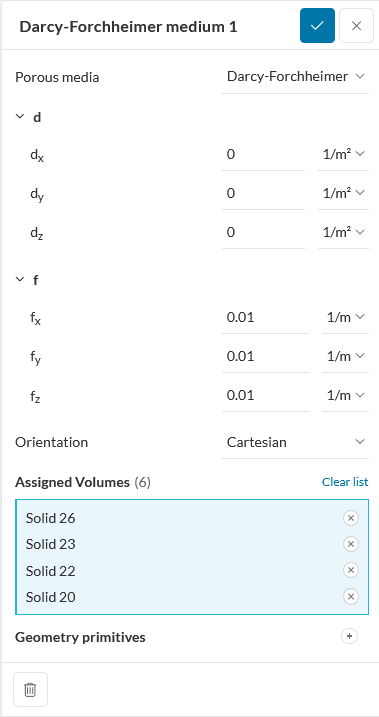
- Advanced concepts -> Porous media ->
Darcy-Forchheimer
In the below grab the trees are more or less not existing
(very low f [=0.01m-1 ]). For leafed trees an
f=0.3, 0.6 and 0.9m-1 have been used. Darcy
coeficient (d) is zero [SIMSCALE, 2023, section TreeModel].
- Mesh
Fineness = 5, 8.2, 8.9 and 9.5 have been used.
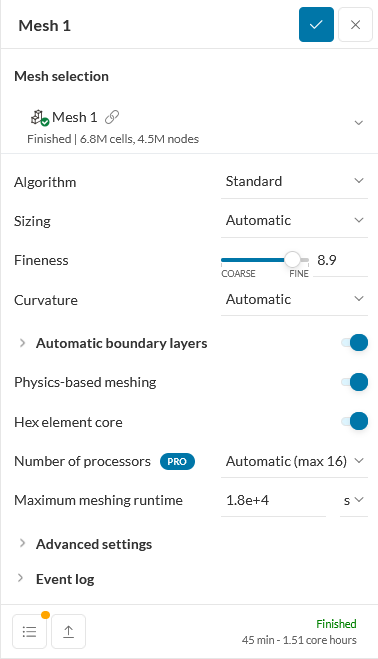
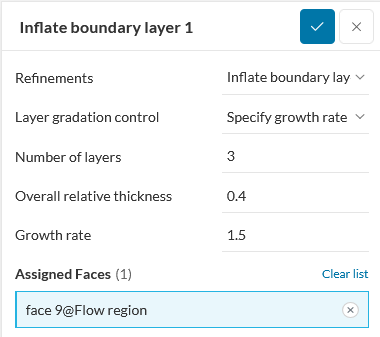
- Mesh -> Refinements -> Inflate boundary layer
- Effort: 2 hours.
Uitvoering van de CFD
Analysis for wind direction at 230deg
- Simulation Runs +
- The windspeed some 240m in front of
the windmill (some 100m from the first buildings) is around
6.9m/sec. This is lower than the inlet ABL (7.1m/sec); don't
know why the ABL is not stable in the first part of
the Flow Volume.
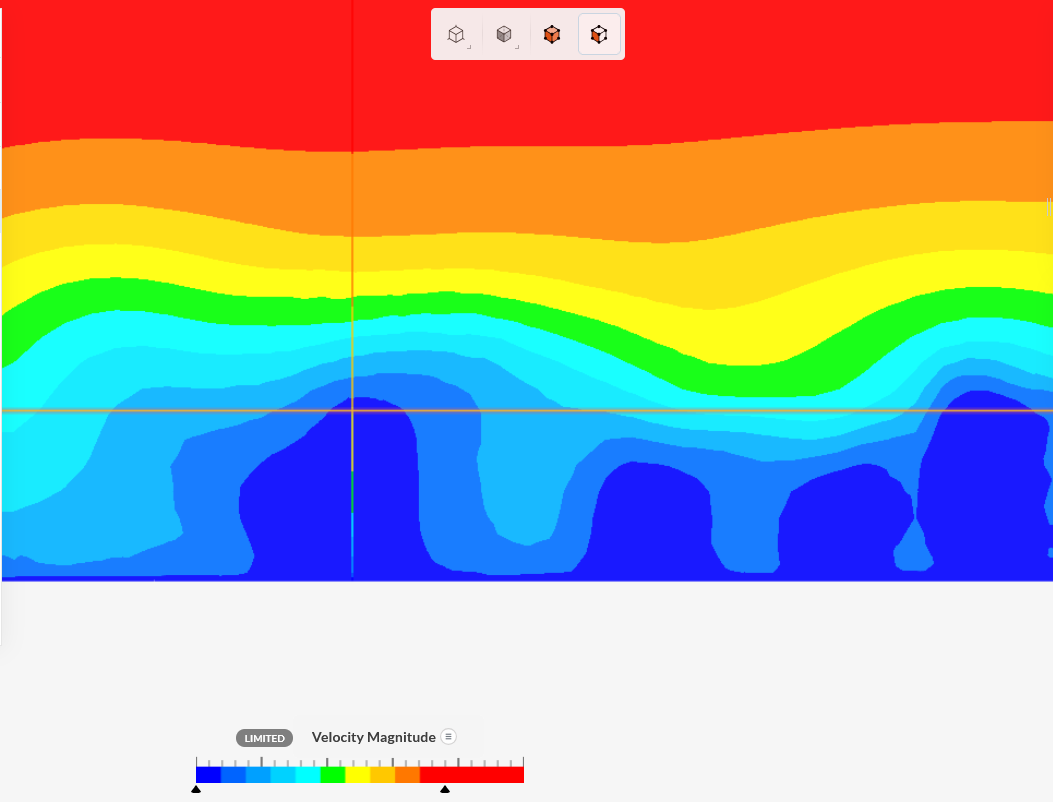
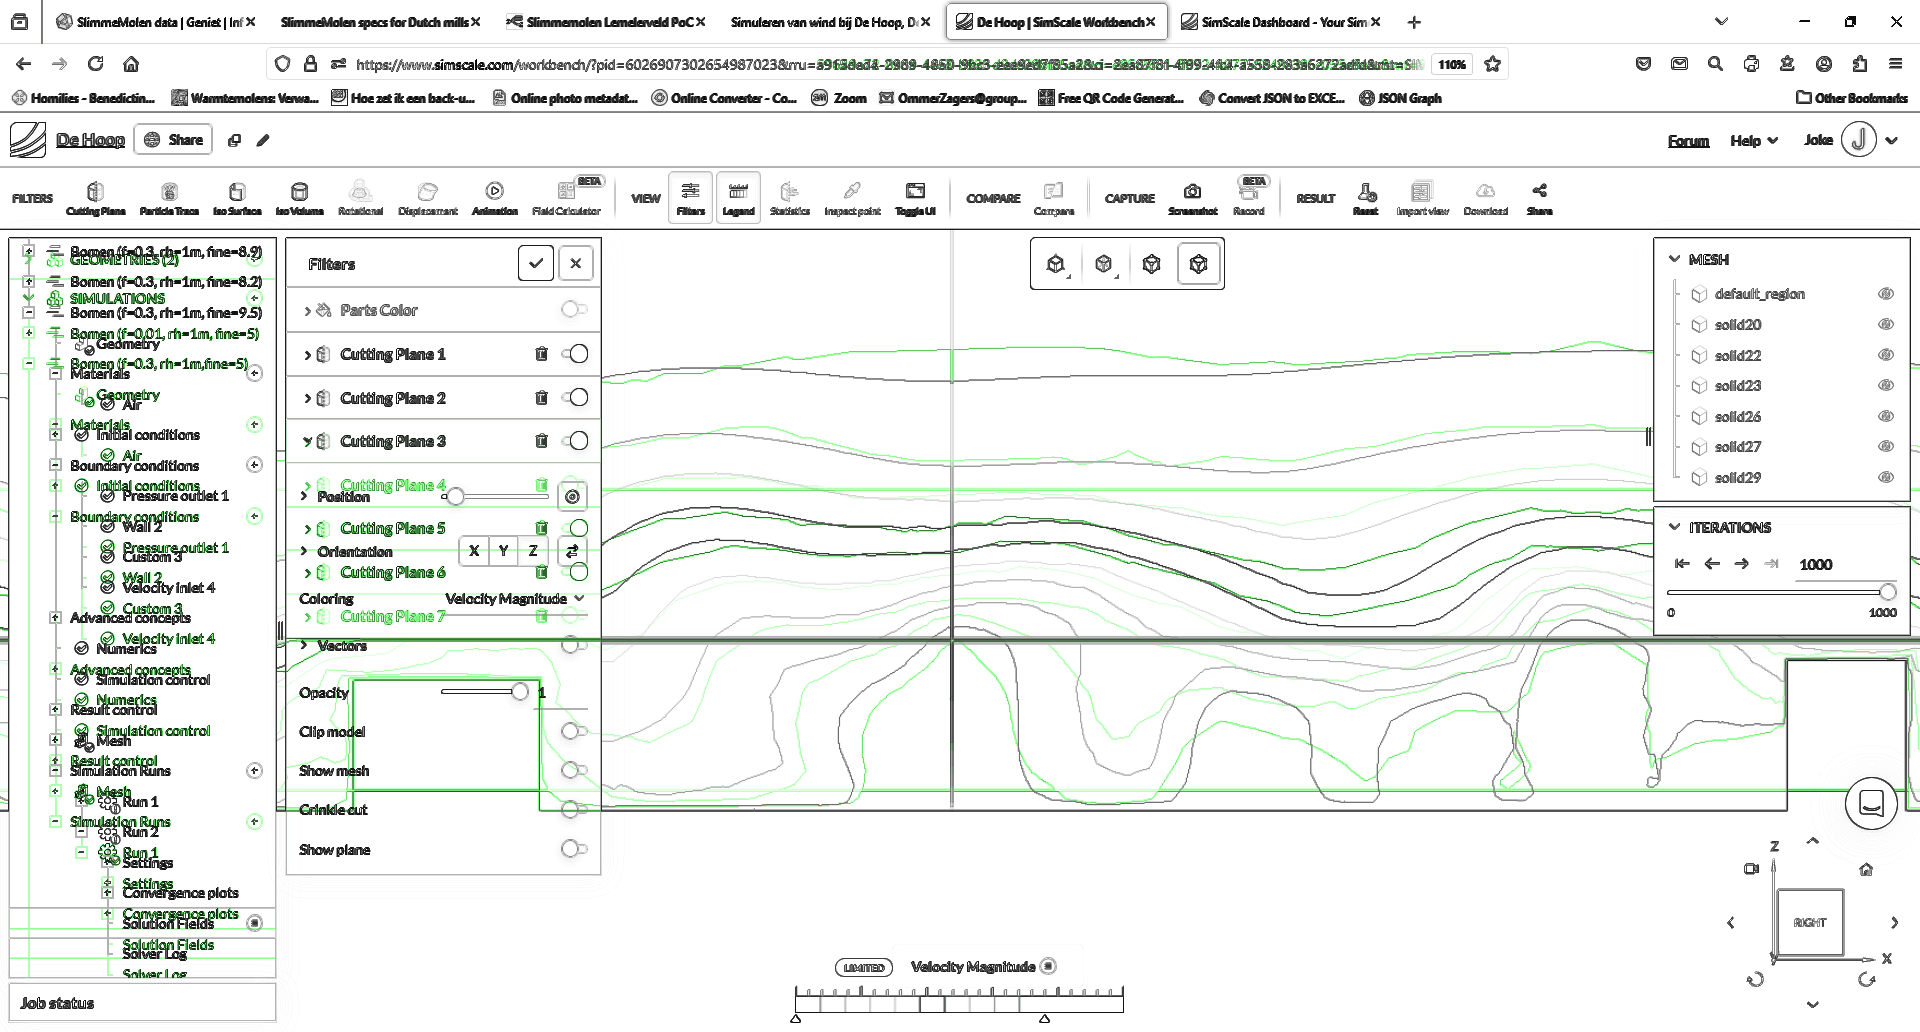
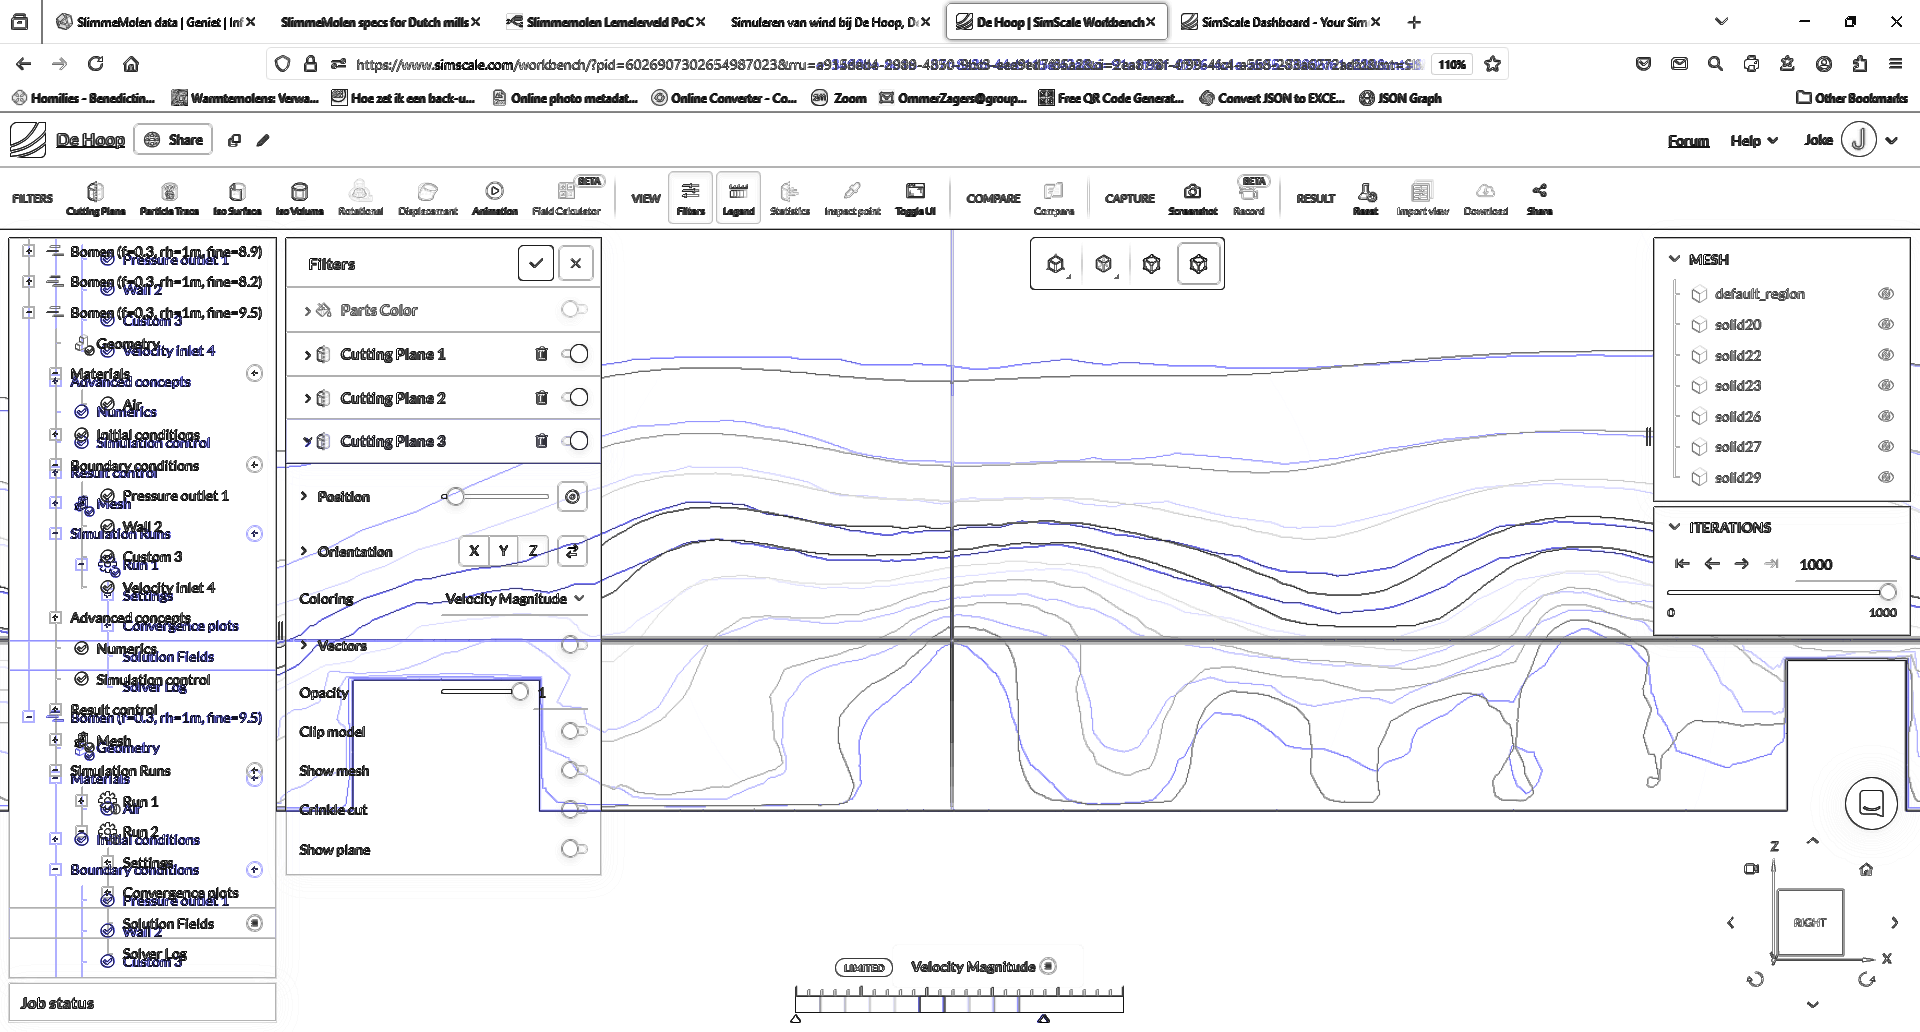
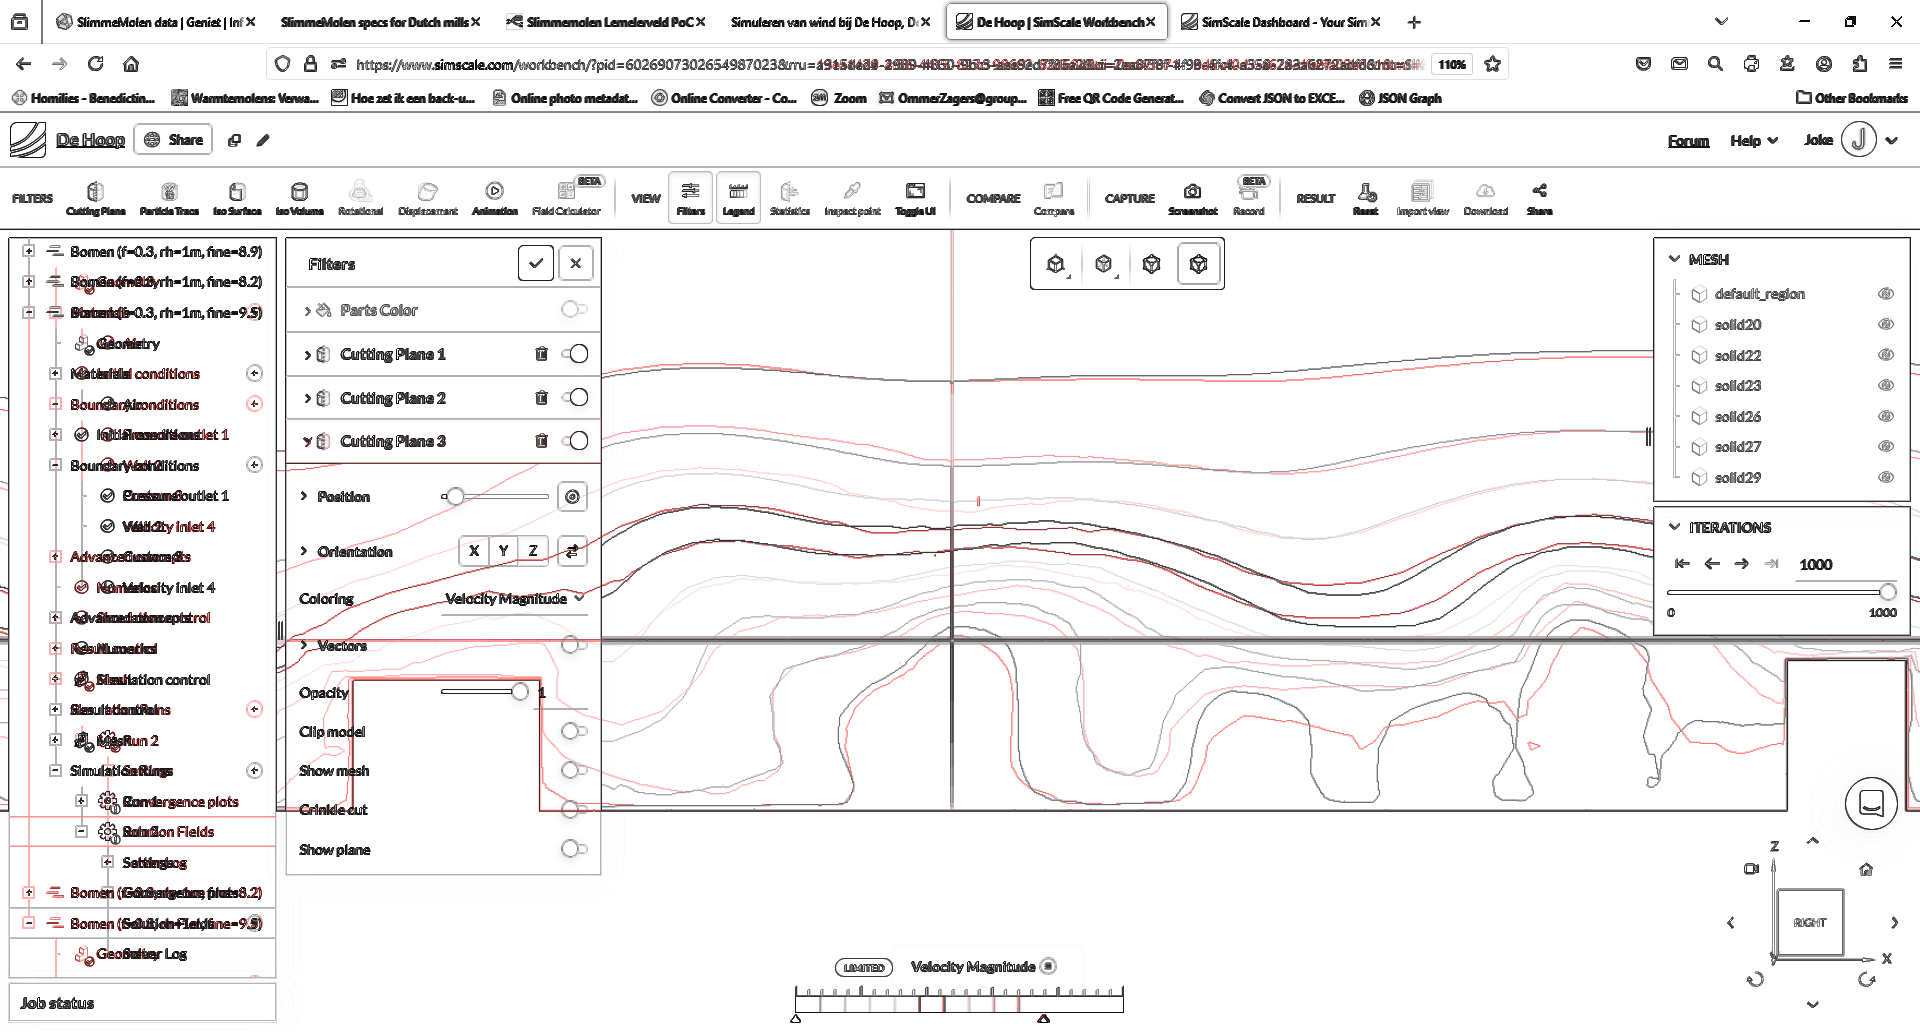
- The (square) plane of the sails is provided in below
pictures. The middle cross is the location of the windshaft. The
sail plane is 1m from the mill cap. The colouring is between 0
(dark blue) and 10 (red) m/sec in steps of 1m/sec.
- Using Forchheimer f=0.01m-1 (virtually no
trees, Fineness=5)
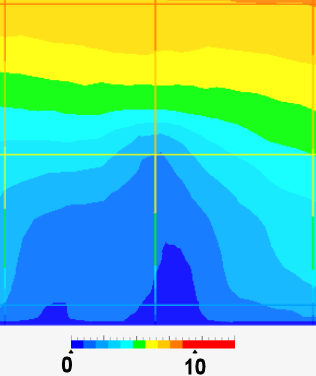
Speed at horizontal sail tips is around 3.6 to 5msec: on
average 4.3m/sec (for Fineness=8.9, is the average tip
speed 4.7m/sec)
- Using Forchheimer f=0.3m-1 (all leafed
trees, Fineness=5)
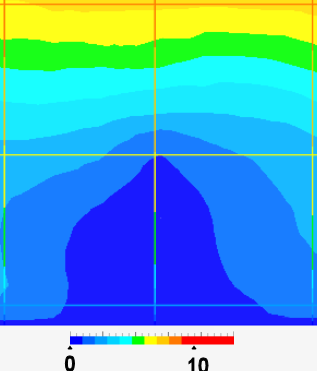
Speed at horizontal sail tips is around 2.8 to 2.9msec: on
average 2.8m/sec (for Fineness=8.9, is the average tip
speed 2.5m/sec)
- For Fineness=5: The windspeed is reduced to 62%
(=4.3/6.9) with no trees and reduced to 42% (=2.8/6.9) with
leaved trees (comparing it with the wind speed in front of the
buildings).
If we compare the influence of all trees with the influence of
existing buildings; the reduction is 68% (=42/62).
- The f for the trees has been differentiated (instead of all
0.3m-1) and the stems are for some at 4m (instead of
2m); they now have f= 0.3, 0.6 and 0.9m-1 (based on uncertainty
about the Cd, the f is 3 times the value in this
table).
- Using Forchheimer fVR=0.3, 0.6
and 0.9m-1 (Fineness=8.9)
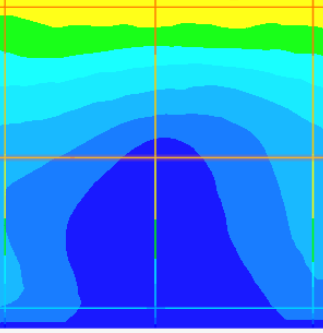
Speed at horizontal sail tips is around 2.4 to 2.6msec: on
average 2.5m/sec
- For Fineness=8.9 and more realistic (less porous)
trees: The windspeed is reduced to 62% (=4.3/6.9) with
no trees and reduced to 36% (=2.5/6.9) with leaved trees
(comparing it with the wind speed in front of the buildings).
If we compare the influence of all trees with the influence of
existing buildings; the reduction is 58% (=36/62).
- It looks better to use SIMSCALE's default of Cd=0.2
(as defined in this table). The f for the
trees is this fVR/3 (=0.2/0.6); now f = fVR/3
=fSIM= 0.1, 0.2 and 0.3m-1
- Using Forchheimer fSIM=0.1, 0.2 and 0.3m-1
(more realistic leafed trees, Fineness=8.9)
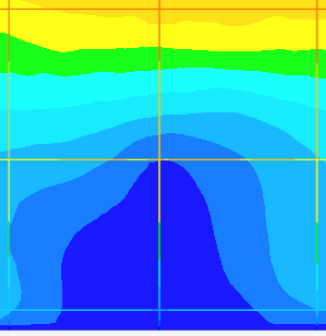
Speed at horizontal sail tips is around 2.8 to 3msec: on
average 2.9m/sec
- For Fineness=8.9 and reduced Cd: The
windspeed is reduced to 62% (=4.3/6.9) with no trees and
reduced to 42% (=2.9/6.9) with leaved trees (comparing it with
the wind speed in front of the buildings).
If we compare the influence of all trees with the influence of
existing buildings; the reduction is 68% (=42/62).
- Influence of f (or better Cd)
on the average tip speed (Fineness=8.9 and only looking
at a 230deg direction):
trees'
f used
[m-1]
|
average
tip
speed
[m/sec]
|
compared
with regard
to free
space
|
compared
with regard
to built
|
0.01
|
4.3
|
68%
|
100%
|
0.3
|
2.5
|
36%
|
58%
|
0.3,0.6,0.9
fVR
|
2.5
|
36%
|
58%
|
0.1,0.2,0.3
fSIM |
2.9
|
42%
|
68%
|
- Varying the meshing:
The number of used CPUhours
is collected below (it also provides an idea if a PWC
[Pedestrian Wind Comfort] of 360degrees [in steps of 10deg]
would be done)
Fineness
|
Mesh
+
Simulation
[CPUhours]
|
Mesh
MCells
|
estimated
duration
PWC of 36
sectors and
128 CPUs
[hours]
|
10
|
#N/A
|
#N/A |
#N/A |
9.5
|
92
|
20
|
26
|
8.9
|
14.7
|
6.8
|
4
|
8.2
|
7
|
3.2
|
2
|
5
|
2.6
|
1.2
|
0.7
|
The speed results (in a plane 1 m from the windshaft head)
differ somewhat, see the below front view (the mill is at the
vertical line):
Fineness = 9.5
(11Mcells)
|
|
|
Speed
difference between
Fineness= 9.5(black) and 5(green)
|
Speed
difference between
Fineness=9.5(black) and 8.2(blue)
|
Speed
difference between
Fineness= 9.5(black) and 8.9(red) |
 |
 |
 |
<for the Difference row: collored/black speed contour-lines
are in steps of 1/msec; max. is 9m/sec>
The speed results for higher Fineness' tend to be lower.
The resuotuion of the results is higher for higher Fineness
(as expected).
The speed differences between Finenesses are determined
for three speed contour-lines: 1m/sec (happens close to wind
shaft location); 5m/sec (happens near highest sail point) and
7m/sec (above mill):
Fineness
comparison
|
Speed
contour
[m/sec]
|
Difference along countour-line
|
Diff.
at mill
location
|
Min diff.
[m/sec]
|
Max
diff.
[m/sec]
|
Largest
|diff.|
[m/sec]
|
Diff.
[m/sec]
|
9.5
- 5
|
1
|
-1.2
|
0.3
|
1.2
|
-0.2
|
5
|
0.3
|
0.6
|
0.6
|
0
|
7
|
-0.2
|
0.3
|
0.33
|
0.1
|
9.5
- 8.2
|
1
|
-0.8
|
0.4
|
0.8
|
-0.2
|
5
|
-0.1
|
0.3
|
0.3
|
-0.1
|
7
|
-0.1
|
0.2
|
0.2
|
0
|
9.5
- 8.9
|
1
|
-0.3
|
0.5
|
0.5
|
-0.1
|
5
|
-0.2
|
0.2
|
0.2
|
0
|
7
|
-0.4
|
0.2
|
0.4
|
-0.3
|
- All mesh metric stay within the
defined min and max range,
at least for the tested Fineness, between 5 and 9.5.
- Effort: 4+3*1= 7 hours.
Analysis for wind direction at 180 to
250deg
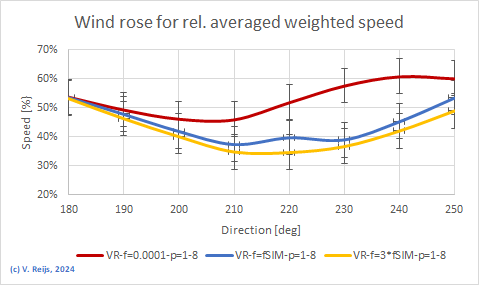
- Weighted relative speeds of different wind directions (each
sector of 10deg used some 20CPUh, Fineness=8.9).
The wind speed/energy is averaged over 8
positions of the long and short rest sail positons.
The standard deviation on relative speed measurements and
simulations is assumed to be (like for Impington) not
less than 6%. The relative energy results migth have a
standard deviation of some 15%.
The simulated speeds are relative to the above ABL (for a 'parkland'). They
are weighted by including
the neighboring sector's speed based on the distribution of the
measured wind direction (with a standard deviation of around
15deg).
Red curve is: built without trees. Blue curve is: built and with
porous trees (using fSIM: SIMSCALE's default Cd=0.2).
Yellow curve is: built and with porous trees (using 3*fSIM:
thus a more
or less three times higher Cd than SIMSCALE).
Here is a comparison of the relative wind speeds:
And here a comparison of relative
energy:
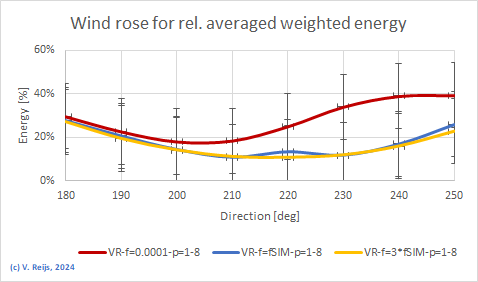
- If using formula (instead of
simulations) the following power increase can be seem (this is
based on the Beljaars'
method, created by V. Reijs, see also here
regarding the way the Effective Useable Energy [EUE] is
determined):
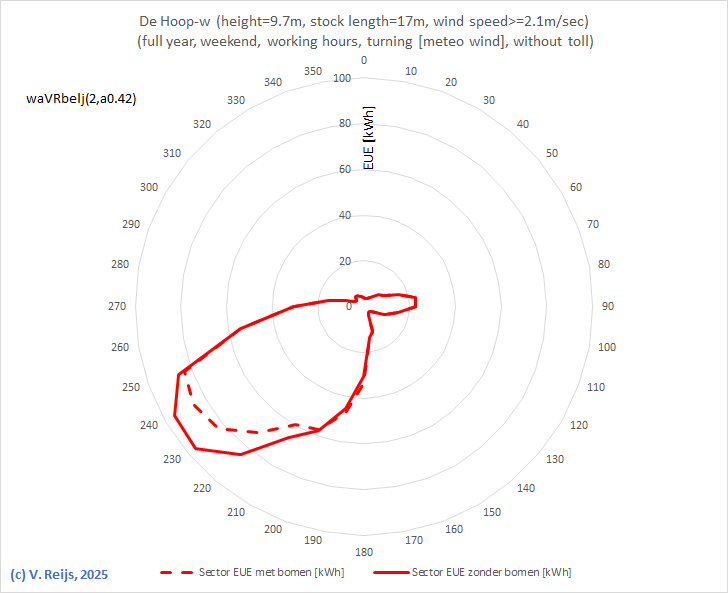
So there is a maximum increase over the sectors 210 to 240deg of
aorund 17%. This is not that far off from the simulations
(22%).
This is also within the important wind direction (SW).
- Again, it shows
that a variation of porosity of the trees does not have that
much influence. This is nice, as up to now the theory behind the
tree's value of porosity is also poor/unclear.
- Effort: expected 3*13*0.5=20 hours.
Conclusions
- Extensive sensitivity
analysis has been performed.
- Make sure one understands this document.
- Het simulatie project kan hier bekeken
worden.
- Only a few default SIMSCALE settings need to change for this
De Hoop simulation:
- Size of External Flow Volume
- Incompressible -> Turbulence-model -> Realizable
k-epsilon
- Increase of mesh Fineness
- Near this simulated mill: the speed does not change much (on
average around 0.2m/sec for the wind regime of 1 to 7m/sec)
when having 1.2Mcell or 20Mcells in the mesh.
- Although the mesh size has been increased (from 1.2 to
20Mcells), no attention has been given to specific (possible
important?) areas where the mesh really/only needed to be
increased.
This needs to be investigated
further.
- The result of SIMSCALE CFD are quite close (within standard
deviation) to another CFD's results.
- Make sure to understand/solve the
above bold purple points.
Some important points to solve:
- The modelling of roof might
be important for buildings nearby a mill.
- Fully understand the influence of the mesh for the mill
environment.
- An overview of outstanding issues/questions/etc is here.
References
Franke, Jörg et al. COST Action 732: Best
practice guideline for the CFD simulation of flows in the urban
environment. Brussels, COST Office 2007.
EAGM, Rapport nr 523006 dd 20mrt2023
WieringerMolens_Windonderzoek_DeHoopAMSTELDIEP, 2023
SIMSCALE, Advanced Modelling PWC,
2023
Acknowledgements
I would like to thank people, such as Rien
Eykelenboom and others for their help, encouragement and/or
constructive feedback. Any remaining errors in methodology or
results are my responsibility of course!!! If you want to
provide constructive feedback, please let me know.
Major content related
changes: October, 21, 2024